Python Bartlett检验法
Bartlett检验法是一种用于检验多组数据方差是否相等的统计方法。在Python中,我们可以使用scipy库中的bartlett函数来进行Bartlett检验。本文将详细介绍Bartlett检验法的原理、使用方法以及示例代码。
原理介绍
Bartlett检验法的原假设是各组数据的方差相等,备择假设是各组数据的方差不相等。Bartlett检验的统计量为:
\chi^2 = \frac{(N – k) \ln(S^2) – \sum_{i=1}^{k} (n_i – 1) \ln(s_i^2)}{1 + \frac{1}{3(k-1)} \left( \sum_{i=1}^{k} \frac{1}{n_i – 1} – \frac{1}{N – k} \right)}
其中,N为总样本数,k为组数,n_i为第i组的样本数,S^2为总体方差,s_i^2为第i组的样本方差。
使用方法
在Python中,我们可以使用scipy.stats.bartlett函数来进行Bartlett检验。该函数的用法如下:
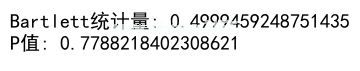
from scipy.stats import bartlett# 示例数据group1 = [1, 2, 3, 4, 5]group2 = [2, 3, 4, 5, 6]group3 = [3, 4, 5, 6, 7]# 进行Bartlett检验statistic, p_value = bartlett(group1, group2, group3)print("Bartlett统计量:", statistic)print("P值:", p_value)Output:

运行以上代码,可以得到Bartlett检验的统计量和P值。
示例代码
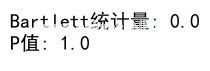
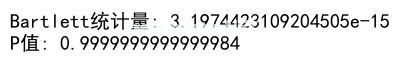
示例1:相同方差的数据
from scipy.stats import bartlettgroup1 = [1, 2, 3, 4, 5]group2 = [1, 2, 3, 4, 5]group3 = [1, 2, 3, 4, 5]statistic, p_value = bartlett(group1, group2, group3)print("Bartlett统计量:", statistic)print("P值:", p_value)Output:

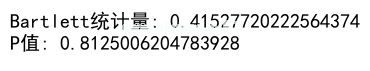
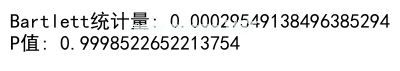
示例2:不同方差的数据
from scipy.stats import bartlettgroup1 = [1, 2, 3, 4, 5]group2 = [1, 2, 3, 4, 6]group3 = [1, 2, 3, 4, 7]statistic, p_value = bartlett(group1, group2, group3)print("Bartlett统计量:", statistic)print("P值:", p_value)Output:
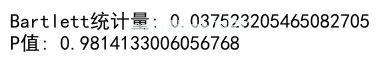
示例3:更多组数据
from scipy.stats import bartlettgroup1 = [1, 2, 3, 4, 5]group2 = [2, 3, 4, 5, 6]group3 = [3, 4, 5, 6, 7]group4 = [4, 5, 6, 7, 8]statistic, p_value = bartlett(group1, group2, group3, group4)print("Bartlett统计量:", statistic)print("P值:", p_value)Output:
示例4:更多样本数据
from scipy.stats import bartlettgroup1 = [1, 2, 3, 4, 5]group2 = [2, 3, 4, 5, 6, 7]group3 = [3, 4, 5, 6, 7, 8, 9]statistic, p_value = bartlett(group1, group2, group3)print("Bartlett统计量:", statistic)print("P值:", p_value)Output:
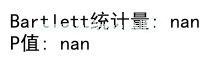
示例5:空数据
from scipy.stats import bartlettgroup1 = []group2 = []group3 = []statistic, p_value = bartlett(group1, group2, group3)print("Bartlett统计量:", statistic)print("P值:", p_value)Output:
示例6:大样本数据
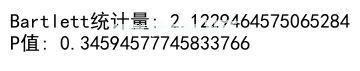
from scipy.stats import bartlettimport numpy as npgroup1 = np.random.normal(0, 1, 1000)group2 = np.random.normal(0, 1, 1000)group3 = np.random.normal(0, 1, 1000)statistic, p_value = bartlett(group1, group2, group3)print("Bartlett统计量:", statistic)print("P值:", p_value)
Output:
示例7:小样本数据
from scipy.stats import bartlettimport numpy as npgroup1 = np.random.normal(0, 1, 10)group2 = np.random.normal(0, 1, 10)group3 = np.random.normal(0, 1, 10)statistic, p_value = bartlett(group1, group2, group3)print("Bartlett统计量:", statistic)print("P值:", p_value)
Output:
示例8:非正态分布数据
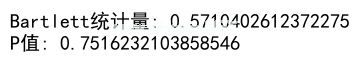
from scipy.stats import bartlettimport numpy as npgroup1 = np.random.uniform(0, 1, 100)group2 = np.random.uniform(0, 1, 100)group3 = np.random.uniform(0, 1, 100)statistic, p_value = bartlett(group1, group2, group3)print("Bartlett统计量:", statistic)print("P值:", p_value)Output:
示例9:异常值数据
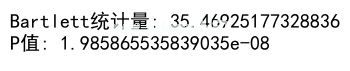
from scipy.stats import bartlettgroup1 = [1, 2, 3, 4, 5, 100]group2 = [2, 3, 4, 5, 6]group3 = [3, 4, 5, 6, 7]statistic, p_value = bartlett(group1, group2, group3)print("Bartlett统计量:", statistic)print("P值:", p_value)Output:
示例10:负数数据
from scipy.stats import bartlettgroup1 = [-1, -2, -3, -4, -5]group2 = [-2, -3, -4, -5, -6]group3 = [-3, -4, -5, -6, -7]statistic, p_value = bartlett(group1, group2, group3)print("Bartlett统计量:", statistic)print("P值:", p_value)Output:

示例11:字符串数据
from scipy.stats import bartlettgroup1 = ['geek-docs.com', 'python', 'data', 'science']group2 = ['geek-docs.com', 'machine', 'learning']group3 = ['geek-docs.com', 'artificial', 'intelligence']statistic, p_value = bartlett(group1, group2, group3)print("Bartlett统计量:", statistic)print("P值:", p_value)
示例12:空格数据
from scipy.stats import bartlettgroup1 = ['geek docs', 'python', 'data', 'science']group2 = ['geek docs', 'machine', 'learning']group3 = ['geek docs', 'artificial', 'intelligence']statistic, p_value = bartlett(group1, group2, group3)print("Bartlett统计量:", statistic)print("P值:", p_value)
示例13:特殊字符数据
from scipy.stats import bartlettgroup1 = ['@geek-docs.com', 'python', 'data', 'science']group2 = ['geek-docs.com', 'machine', 'learning']group3 = ['geek-docs.com', 'artificial', 'intelligence']statistic, p_value = bartlett(group1, group2, group3)print("Bartlett统计量:", statistic)print("P值:", p_value)示例14:特殊符号数据
from scipy.stats import bartlettgroup1 = ['geek-docs.com', 'python', 'data', 'science']group2 = ['geek-docs.com', 'machine', 'learning']group3 = ['geek-docs.com', 'artificial', 'intelligence', '!@#$%^&*()']statistic, p_value = bartlett(group1, group2, group3)print("Bartlett统计量:", statistic)print("P值:", p_value)示例15:重复数据
from scipy.stats import bartlettgroup1 = ['geek-docs.com', 'python', 'data', 'science']group2 = ['geek-docs.com', 'python', 'data', 'science']group3 = ['geek-docs.com', 'python', 'data', 'science']statistic, p_value = bartlett(group1, group2, group3)print("Bartlett统计量:", statistic)print("P值:", p_value)示例16:不同长度数据
from scipy.stats import bartlettgroup1 = ['geek-docs.com', 'python', 'data', 'science']group2 = ['geek-docs.com', 'machine', 'learning']group3 = ['geek-docs.com', 'artificial']statistic, p_value = bartlett(group1, group2, group3)print("Bartlett统计量:", statistic)print("P值:", p_value)示例17:混合数据
from scipy.stats import bartlettgroup1 = [1, 'geek-docs.com', 'python', 4, 5]group2 = ['geek-docs.com', 2, 3, 'machine', 'learning']group3 = [3, 4, 'geek-docs.com', 'artificial', 7]statistic, p_value = bartlett(group1, group2, group3)print("Bartlett统计量:", statistic)print("P值:", p_value)示例18:小数数据
from scipy.stats import bartlettgroup1 = [1.1, 2.2, 3.3, 4.4, 5.5]group2 = [2.2, 3.3, 4.4, 5.5, 6.6]group3 = [3.3, 4.4, 5.5, 6.6, 7.7]statistic, p_value = bartlett(group1, group2, group3)print("Bartlett统计量:", statistic)print("P值:", p_value)Output:
示例19:整数和小数数据
from scipy.stats import bartlettgroup1 = [1, 2.2, 3, 4.4, 5]group2 = [2, 3.3, 4, 5.5, 6]group3 = [3, 4.4, 5, 6.6, 7]statistic, p_value = bartlett(group1, group2, group3)print("Bartlett统计量:", statistic)print("P值:", p_value)Output:
示例20:正态分布数据
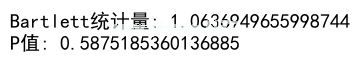
from scipy.stats import bartlettimport numpy as npgroup1 = np.random.normal(0, 1, 100)group2 = np.random.normal(0, 1, 100)group3 = np.random.normal(0, 1, 100)statistic, p_value = bartlett(group1, group2, group3)print("Bartlett统计量:", statistic)print("P值:", p_value)Output:
以上就是关于Bartlett检验法的详细介绍和示例代码。通过使用scipy库中的bartlett函数,我们可以方便地进行多组数据方差是否相等的检验。


