db file scattered read等待事件有三个参数,属于User I/O类的等待
:
SQL> select name,parameter1,parameter2,parameter3,wait_class from v$event_name where name = 'db file scattered read';
NAME PARAMETER1 PARAMETER2 PARAMETER3 WAIT_CLASS
------------------------------ ---------- ---------- ---------- ----------
db file sequential read file# block# blocks User I/O
file#:要读取的数据块锁在数据文件的文件号。
block#:要读取的起始数据块号。
blocks:要读取的数据块数目。
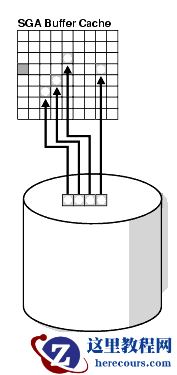
当会话发出一个读入多个数据块的I/O请求时提交db file scattered read(数据文件离散读取)等待事件
。过程如图:
 db file scattered read等待事件发生的原因
:
1.全表扫描
2.索引快速全扫描
在此,我们来分别对2种情况进行验证。
首先,创建测试表:
SQL> create table scott.tb_test(id int,age int,name varchar2(20));
Table created.
插入测试数据:
SQL> begin
2 for i in 1..1000 loop
3 insert into scott.tb_test values(i,i+1,'test');
4 end loop;
5 commit;
6 end;
7 /
PL/SQL procedure successfully completed.
在另外的session中对当前session进行10046追踪:
SQL> oradebug setospid 9305
Oracle pid: 22, Unix process pid: 9305, image: oracle@zhuga (TNS V1-V3)
SQL> oradebug event 10046 trace name context forever,level 12
Statement processed.
SQL> oradebug tracefile_name
/opt/app/oracle/diag/rdbms/bddev2/BDDEV2/trace/BDDEV2_ora_9305.trc
对测试表进行操作,持续观察追踪文件的输出。
db file scattered read等待事件发生的原因
:
1.全表扫描
2.索引快速全扫描
在此,我们来分别对2种情况进行验证。
首先,创建测试表:
SQL> create table scott.tb_test(id int,age int,name varchar2(20));
Table created.
插入测试数据:
SQL> begin
2 for i in 1..1000 loop
3 insert into scott.tb_test values(i,i+1,'test');
4 end loop;
5 commit;
6 end;
7 /
PL/SQL procedure successfully completed.
在另外的session中对当前session进行10046追踪:
SQL> oradebug setospid 9305
Oracle pid: 22, Unix process pid: 9305, image: oracle@zhuga (TNS V1-V3)
SQL> oradebug event 10046 trace name context forever,level 12
Statement processed.
SQL> oradebug tracefile_name
/opt/app/oracle/diag/rdbms/bddev2/BDDEV2/trace/BDDEV2_ora_9305.trc
对测试表进行操作,持续观察追踪文件的输出。
1.全表扫描
当前session中执行如下语句: SQL> alter system flush buffer_cache; System altered. SQL> select * from scott.tb_test where age = 2; ID AGE NAME ---------- ---------- ----- 1 2 test 查看追踪文件: *** 2018-11-08 14:22:24.399 WAIT #139755673442328: nam='SQL*Net message from client' ela= 9621966 driver id=1650815232 #bytes=1 p3=0 obj#=91054 tim=1541658144399459 CLOSE #139755673442328:c=0,e=9,dep=0,type=3,tim=1541658144399580 ===================== PARSING IN CURSOR #139755673515256 len=41 dep=0 uid=0 oct=3 lid=0 tim=1541658144399734 hv=3789676117 ad='55ad24638' sqlid='493dsa3hy3rkp' select * from scott.tb_test where age = 2 END OF STMT PARSE #139755673515256:c=144,e=113,p=0,cr=0,cu=0,mis=0,r=0,dep=0,og=1,plh=1092599453,tim=1541658144399732 EXEC #139755673515256:c=0,e=27,p=0,cr=0,cu=0,mis=0,r=0,dep=0,og=1,plh=1092599453,tim=1541658144399967 WAIT #139755673515256: nam='SQL*Net message to client' ela= 2 driver id=1650815232 #bytes=1 p3=0 obj#=91054 tim=1541658144400005 WAIT #139755673515256: nam='db file sequential read' ela= 13 file#=5 block#=178 blocks=1 obj#=91054 tim=1541658144400098 WAIT #139755673515256: nam='db file scattered read' ela= 20 file#=5 block#=179 blocks=5 obj#=91054 tim=1541658144400359 FETCH #139755673515256:c=0,e=427,p=6,cr=5,cu=0,mis=0,r=1,dep=0,og=1,plh=1092599453,tim=1541658144400458 WAIT #139755673515256: nam='SQL*Net message from client' ela= 179 driver id=1650815232 #bytes=1 p3=0 obj#=91054 tim=1541658144400675 FETCH #139755673515256:c=0,e=44,p=0,cr=3,cu=0,mis=0,r=0,dep=0,og=1,plh=1092599453,tim=1541658144400760 STAT #139755673515256 id=1 cnt=1 pid=0 pos=1 obj=91054 op='TABLE ACCESS FULL TB_TEST (cr=8 pr=6 pw=0 time=414 us cost=3 size=38 card=1)' WAIT #139755673515256: nam='SQL*Net message to client' ela= 1 driver id=1650815232 #bytes=1 p3=0 obj#=91054 tim=1541658144400842 可看到 发生了一次单块读和一次多块读,其中单块读是访问scott.tb_test的头块 : SQL> select owner,header_file,header_block from dba_segments where segment_name = 'TB_TEST'; OWNER HEADER_FILE HEADER_BLOCK ------------------------------ ----------- ------------ SCOTT 5 178 多块读是读取的scott.tb_test的数据块 : SQL> select distinct dbms_rowid.rowid_relative_fno(rowid),dbms_rowid.rowid_block_number(rowid) from scott.tb_test order by 2; DBMS_ROWID.ROWID_RELATIVE_FNO(ROWID) DBMS_ROWID.ROWID_BLOCK_NUMBER(ROWID) ------------------------------------ ------------------------------------ 5 179 5 182 5 183
2.索引快速全扫描
创建索引: SQL> create index scott.idx_id on scott.tb_test(id); Index created. 当前session中执行如下语句: SQL> alter system flush buffer_cache; System altered. SQL> select id from scott.tb_test where id = 100; 查看跟踪文件: PARSING IN CURSOR #139755673927112 len=43 dep=0 uid=0 oct=3 lid=0 tim=1541659656338252 hv=2432667479 ad='55b721790' sqlid='1vgubku8gz3ur' select id from scott.tb_test where id = 100 END OF STMT PARSE #139755673927112:c=0,e=80,p=0,cr=0,cu=0,mis=0,r=0,dep=0,og=1,plh=578627003,tim=1541659656338250 EXEC #139755673927112:c=0,e=32,p=0,cr=0,cu=0,mis=0,r=0,dep=0,og=1,plh=578627003,tim=1541659656338348 WAIT #139755673927112: nam='SQL*Net message to client' ela= 2 driver id=1650815232 #bytes=1 p3=0 obj#=91056 tim=1541659656338387 WAIT #139755673927112: nam='db file sequential read' ela= 20 file#=5 block#=187 blocks=1 obj#=91057 tim=1541659656338473 WAIT #139755673927112: nam='db file sequential read' ela= 9 file#=5 block#=188 blocks=1 obj#=91057 tim=1541659656338534 FETCH #139755673927112:c=163,e=192,p=2,cr=2,cu=0,mis=0,r=1,dep=0,og=1,plh=578627003,tim=1541659656338602 WAIT #139755673927112: nam='SQL*Net message from client' ela= 158 driver id=1650815232 #bytes=1 p3=0 obj#=91057 tim=1541659656338804 FETCH #139755673927112:c=89,e=88,p=0,cr=1,cu=0,mis=0,r=0,dep=0,og=1,plh=578627003,tim=1541659656338941 STAT #139755673927112 id=1 cnt=1 pid=0 pos=1 obj=91057 op='INDEX RANGE SCAN IDX_ID (cr=3 pr=2 pw=0 time=186 us cost=1 size=13 card=1)' WAIT #139755673927112: nam='SQL*Net message to client' ela= 1 driver id=1650815232 #bytes=1 p3=0 obj#=91057 tim=1541659656339036 可看到此时执行计划走的是 索引范围扫描,此时等待事件是db file sequential read 。添加hint,强制走索引快速全扫描: SQL> alter system flush buffer_cache; System altered. SQL> select /*+ index_ffs(tb_test idx_id)*/ id from scott.tb_test where id = 100; ID ---------- 100 查看跟踪文件: PARSING IN CURSOR #139755673927112 len=75 dep=0 uid=0 oct=3 lid=0 tim=1541659831795488 hv=2021045085 ad='55a741cc0' sqlid='8hbw5jtw7dcux' select /*+ index_ffs(tb_test idx_id)*/ id from scott.tb_test where id = 100 END OF STMT PARSE #139755673927112:c=2808,e=2974,p=10,cr=11,cu=0,mis=1,r=0,dep=0,og=1,plh=3381169862,tim=1541659831795487 EXEC #139755673927112:c=16,e=16,p=0,cr=0,cu=0,mis=0,r=0,dep=0,og=1,plh=3381169862,tim=1541659831795676 WAIT #139755673927112: nam='SQL*Net message to client' ela= 2 driver id=1650815232 #bytes=1 p3=0 obj#=91056 tim=1541659831795714 WAIT #139755673927112: nam='db file sequential read' ela= 10 file#=5 block#=186 blocks=1 obj#=91057 tim=1541659831795799 FETCH #139755673927112:c=810,e=116,p=1,cr=4,cu=0,mis=0,r=1,dep=0,og=1,plh=3381169862,tim=1541659831795853 WAIT #139755673927112: nam='SQL*Net message from client' ela= 130 driver id=1650815232 #bytes=1 p3=0 obj#=91057 tim=1541659831796029 WAIT #139755673927112: nam='db file scattered read' ela= 6 file#=5 block#=189 blocks=2 obj#=91057 tim=1541659831796106 FETCH #139755673927112:c=0,e=107,p=2,cr=3,cu=0,mis=0,r=0,dep=0,og=1,plh=3381169862,tim=1541659831796169 STAT #139755673927112 id=1 cnt=1 pid=0 pos=1 obj=91057 op='INDEX FAST FULL SCAN IDX_ID (cr=7 pr=3 pw=0 time=92 us cost=4 size=13 card=1)' WAIT #139755673927112: nam='SQL*Net message to client' ela= 1 driver id=1650815232 #bytes=1 p3=0 obj#=91057 tim=1541659831796258 可看到此时 执行计划走了索引快速全扫描,并且出现了一个单块读(读索引的块头)和一个多块读 ,多块读发生的对象正好是索引: SQL> select owner,segment_name,segment_type from dba_extents where file_id = 5 and 189 between block_id and block_id+blocks-1; OWNER SEGMENT_NAME SEGMENT_TYPE ---------- -------------------- -------------------- SCOTT IDX_ID INDEX
注意:
1.平均等待时间不应该超过20ms, 否则证明存储存在争用。 2.OLTP系统应避免出现此等待事件。 3.优化方式:加大SGA, 避免全表扫描,提高存储性能,对频繁访问的做cache等。 4.调高数据库参数: db_file_multiblock_read_count可降低等待次数,但大于1MB/blocks_size无效。


