环境介绍: 为保持一致,客户环境为Oracle10.2.0.5,系统环境一个为aix,一个为Linux,通过某同步软件逻辑实时同步。 当执行以下语句时,两个环境一个走并行,一个走索引
select count(*),sum(id) from mytest.tp1 t1 where
 t1.d_date>=to_date('2019/03/1','yyyy/mm/dd') and
 t1.d_date<to_date('2019/03/20','yyyy/mm/dd');
具体显示如下:
--t1表,模拟新环境,目标端
PLAN_TABLE_OUTPUT
------------------------------------------------------------------------------------------------------------------------
Plan hash value: 580738228
----------------------------------------------------------------------------------------------------------------
| Id  | Operation	       | Name	  | Rows  | Bytes | Cost (%CPU)| Time	  |    TQ  |IN-OUT| PQ Distrib |
----------------------------------------------------------------------------------------------------------------
|   0 | SELECT STATEMENT       |	  |	1 |    13 |  3830   (1)| 00:00:46 |	   |	  |	       |
|   1 |  SORT AGGREGATE        |	  |	1 |    13 |	       |	  |	   |	  |	       |
|   2 |   PX COORDINATOR       |	  |	  |	  |	       |	  |	   |	  |	       |
|   3 |    PX SEND QC (RANDOM) | :TQ10000 |	1 |    13 |	       |	  |  Q1,00 | P->S | QC (RAND)  |
|   4 |     SORT AGGREGATE     |	  |	1 |    13 |	       |	  |  Q1,00 | PCWP |	       |
|   5 |      PX BLOCK ITERATOR |	  |  6094 | 79222 |  3830   (1)| 00:00:46 |  Q1,00 | PCWC |	       |
|*  6 |       TABLE ACCESS FULL| TP1	  |  6094 | 79222 |  3830   (1)| 00:00:46 |  Q1,00 | PCWP |	       |
----------------------------------------------------------------------------------------------------------------
Predicate Information (identified by operation id):
---------------------------------------------------
   6 - filter("T1"."D_DATE"<TO_DATE(' 2019-03-20 00:00:00', 'syyyy-mm-dd hh24:mi:ss') AND
	      "T1"."D_DATE">=TO_DATE(' 2019-03-01 00:00:00', 'syyyy-mm-dd hh24:mi:ss'))
19 rows selected.
--t2表,老环境
PLAN_TABLE_OUTPUT
------------------------------------------------------------------------------------------------------------------------
Plan hash value: 2098670336
---------------------------------------------------------------------------------------------
| Id  | Operation		     | Name	    | Rows  | Bytes | Cost (%CPU)| Time     |
---------------------------------------------------------------------------------------------
|   0 | SELECT STATEMENT	     |		    |	  1 |	 13 |  3076   (1)| 00:00:37 |
|   1 |  SORT AGGREGATE 	     |		    |	  1 |	 13 |		 |	    |
|   2 |   TABLE ACCESS BY INDEX ROWID| TP2	    |  6094 | 79222 |  3076   (1)| 00:00:37 |
|*  3 |    INDEX RANGE SCAN	     | TP2_IND_DATE |  6094 |	    |	 18   (0)| 00:00:01 |
---------------------------------------------------------------------------------------------
PLAN_TABLE_OUTPUT
------------------------------------------------------------------------------------------------------------------------
Predicate Information (identified by operation id):
---------------------------------------------------
   3 - access("T1"."D_DATE">=TO_DATE(' 2019-03-01 00:00:00', 'syyyy-mm-dd
	      hh24:mi:ss') AND "T1"."D_DATE"<TO_DATE(' 2019-03-20 00:00:00', 'syyyy-mm-dd
	      hh24:mi:ss'))
17 rows selected.
--表数据,均为以下
SQL> select count(*),sum(id) from tp2 t1 where
t1.d_date>=to_date('2019/03/1','yyyy/mm/dd') and
t1.d_date<to_date('2019/03/20','yyyy/mm/dd');
  COUNT(*)    SUM(ID)
---------- ----------
      6278  313589166
检查表及索引相关信息:
--表相关信息
OWNER	 TABLE_NAME	 OBJECT_TYPE	  size_g  STATUS   DEGREE	   LAST_ANAL CREATED
------------------- ---------------- ------------------------   ------------- --------
MYTEST	 TP1		 TABLE			 .390625 VALID	    4	       02-APR-20 02-APR-20
MYTEST	 TP2		 TABLE			 .390625 VALID	    4	       02-APR-20 02-APR-20
--索引
OWNER			       INDEX_NAME		      S.BYTES/1024/1024/1024 LAST_ANAL CLUSTERING_FACTOR CREATED
------------------------------ ------------------------------ ---------------------- --------- ----------------- ---------
MYTEST			       TP2_IND_DATE				  .002929688 02-APR-20		   50153 02-APR-20
MYTEST			       TP1_IND_DATE				  .002929688 02-APR-20		   99822 02-APR-20
通过以上,发现,主要差异在索引集群引子上,那么什么会引起集群引子高呢,索引所对应的列比较无序或散,如果不回表,只是查询索引列没有影响,如果需要回表,索引所对应列会反复读取块中数据,大致类似如下:
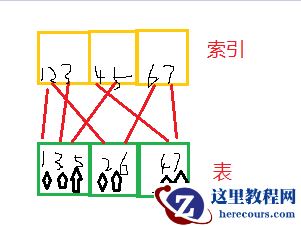 如上图所示,如果我要查询2-5行数据,索引范围扫描,按照顺序扫描(索引三个块,表三个块),2找表块2,3找表块1,4找表块3,5又找表块1. 表块1需要被反复读取,造成资源尤其io资源浪费。
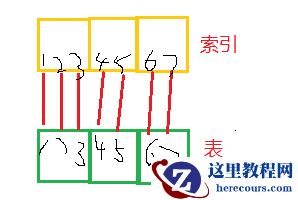
如果良好的表和索引结构如下
如上图所示,如果我要查询2-5行数据,索引范围扫描,按照顺序扫描(索引三个块,表三个块),2找表块2,3找表块1,4找表块3,5又找表块1. 表块1需要被反复读取,造成资源尤其io资源浪费。
如果良好的表和索引结构如下
 我们大概知道原因了,那么怎么形成的呢?
并行查询。正常时间列,一般按照时间顺序写入,或更新(更新可能会有出入),写入是顺序写入,那么在该列上创建索引,效果相对可以。如果并行呢,就是本来一个块上的数据,根据并行度,到目标端可能是多个块,例如并行度为4,原来这个块上就有4行有序数据,到了目标端变成了4个块,以此类推。
我们看一下两张表部分数据块分布情况对比,对比如下:
我们大概知道原因了,那么怎么形成的呢?
并行查询。正常时间列,一般按照时间顺序写入,或更新(更新可能会有出入),写入是顺序写入,那么在该列上创建索引,效果相对可以。如果并行呢,就是本来一个块上的数据,根据并行度,到目标端可能是多个块,例如并行度为4,原来这个块上就有4行有序数据,到了目标端变成了4个块,以此类推。
我们看一下两张表部分数据块分布情况对比,对比如下:
DATE_PER_D t1blk_count t2blk_count  t1-t2_blk
---------- ----------- ----------- ----------
2019/03/11	   314	       157	  157
2019/03/12	   305	       153	  152
2019/03/13	   339	       170	  169
2019/03/14	   358	       179	  179
2019/03/15	   322	       162	  160
2019/03/16	   345	       174	  171
2019/03/17	   337	       169	  168
2019/03/18	   341	       172	  169
2019/03/19	   343	       173	  170
通过上边可以发现,同样的数据,例如3月11日这一天的数据,tp1列d_date分布在214个块,tp2分布在157个块。数据库会自动选择相对效果更好的执行计划,因此会出现两个相同表,索引计划不同的情况。 相关测试语句及环境如下:
create table tp1 (id int,vid varchar2(4000),d_date date);
create table tp2 (id int,vid varchar2(4000),d_date date);
--随时生成日期,等相关数据
declare
  i int := 0;
begin
for i in 1 .. 100000 loop
insert into tp1 values(i,i||'_'||rpad('*','2990','*'),(select to_date('2019/'||trunc(DBMS_RANDOM.VALUE(1, 12))||'/'||trunc(DBMS_RANDOM.VALUE(1, 28)), 'yyyy/mm/dd') from dual));
end loop;
commit;
end;
--插入相关数据,并开启并行,tp2 模拟顺序写入
insert into tp2 select * from tp1 order by d_date;
alter table tp1 parallel 4;
alter table tp2 parallel 4;
--创建索引,收集统计信息
create index tp1_ind_date on tp1(d_date);
create index tp2_ind_date on tp2(d_date);
exec dbms_stats.gather_table_stats('MYTEST','TP1',degree => 4,cascade => true);
exec dbms_stats.gather_table_stats('MYTEST','TP2',degree => 4,cascade => true);
--查看块分布,根据rowid,rowid18位,对象号6+文件号3+块号6+行号3
select to_char(t1.d_date,'yyyy/mm/dd') date_per_D,count(distinct lpad(t1.rowid,15)) as "t1blk_count",count(distinct lpad(t2.rowid,15)) as "t2blk_count" ,
count(distinct lpad(t1.rowid,15))-count(distinct lpad(t2.rowid,15)) as "t1-t2_blk" from tp1 t1,tp2 t2
where to_char(t1.d_date,'yyyy/mm/dd')=to_char(t2.d_date,'yyyy/mm/dd') and t1.d_date>=to_date('2019/03/11','yyyy/mm/dd')
and t1.d_date<to_date('2019/03/20','yyyy/mm/dd') group by to_char(t1.d_date,'yyyy/mm/dd') order by 1;
--查看表大小
set lines 200
set pages 999
select t.owner,t.table_name,o.object_type,s.bytes/1024/1024/1024,t.status,t.DEGREE,t.LAST_ANALYZED,o.created
from dba_tables t ,dba_objects o ,dba_segments s where (t.table_name=o.object_name and o.object_name=s.segment_name)
and t.owner='MYTEST'  and t.table_name like 'TP%';
--查看索引
select d.owner,d.index_name,s.bytes/1024/1024/1024,d.LAST_ANALYZED,d.CLUSTERING_FACTOR,o.created from dba_indexes d,dba_segments s ,dba_objects o
where d.index_name=s.segment_name and d.index_name = o.object_name and d.owner='MYTEST'  and d.table_name like 'TP%' order by s.bytes desc;
上述只是模拟一个列的情况,一般而言,列多,索引多的情况下,至少有个索引的集群引子是比较好的。生产环境中,表大小为250g,无lob,不是分区。如果表调整为分区,效果会好很多。 附:Oracle成本选择示例:
--tp1 选择并行
 Access Path: TableScan
    Cost:  13786.68  Resp: 3829.63  Degree: 0
      Cost_io: 13786.00  Cost_cpu: 25181818
      Resp_io: 3829.44  Resp_cpu: 6994949
  Access Path: index (RangeScan)
    Index: TP1_IND_DATE
    resc_io: 6102.00  resc_cpu: 45832077
    ix_sel: 0.060943  ix_sel_with_filters: 0.060943
    Cost: 6103.24  Resp: 6103.24  Degree: 1
  Best:: AccessPath: TableScan
         Cost: 3829.63  Degree: 4  Resp: 3829.63  Card: 6094.28  Bytes: 0
--tp2  选择索引
Access Path: TableScan
    Cost:  13786.68  Resp: 3829.63  Degree: 0
      Cost_io: 13786.00  Cost_cpu: 25181818
      Resp_io: 3829.44  Resp_cpu: 6994949
  Access Path: index (RangeScan)
    Index: TP2_IND_DATE
    resc_io: 3075.00  resc_cpu: 24275478
    ix_sel: 0.060943  ix_sel_with_filters: 0.060943
    Cost: 3075.66  Resp: 3075.66  Degree: 1
  Best:: AccessPath: IndexRange
  Index: TP2_IND_DATE
         Cost: 3075.66  Degree: 1  Resp: 3075.66  Card: 6094.28  Bytes: 0
环境介绍: 为保持一致,客户环境为Oracle10.2.0.5,系统环境一个为aix,一个为Linux,通过某同步软件逻辑实时同步。 当执行以下语句时,两个环境一个走并行,一个走索引
select count(*),sum(id) from mytest.tp1 t1 where
 t1.d_date>=to_date('2019/03/1','yyyy/mm/dd') and
 t1.d_date<to_date('2019/03/20','yyyy/mm/dd');
具体显示如下:
--t1表,模拟新环境,目标端
PLAN_TABLE_OUTPUT
------------------------------------------------------------------------------------------------------------------------
Plan hash value: 580738228
----------------------------------------------------------------------------------------------------------------
| Id  | Operation	       | Name	  | Rows  | Bytes | Cost (%CPU)| Time	  |    TQ  |IN-OUT| PQ Distrib |
----------------------------------------------------------------------------------------------------------------
|   0 | SELECT STATEMENT       |	  |	1 |    13 |  3830   (1)| 00:00:46 |	   |	  |	       |
|   1 |  SORT AGGREGATE        |	  |	1 |    13 |	       |	  |	   |	  |	       |
|   2 |   PX COORDINATOR       |	  |	  |	  |	       |	  |	   |	  |	       |
|   3 |    PX SEND QC (RANDOM) | :TQ10000 |	1 |    13 |	       |	  |  Q1,00 | P->S | QC (RAND)  |
|   4 |     SORT AGGREGATE     |	  |	1 |    13 |	       |	  |  Q1,00 | PCWP |	       |
|   5 |      PX BLOCK ITERATOR |	  |  6094 | 79222 |  3830   (1)| 00:00:46 |  Q1,00 | PCWC |	       |
|*  6 |       TABLE ACCESS FULL| TP1	  |  6094 | 79222 |  3830   (1)| 00:00:46 |  Q1,00 | PCWP |	       |
----------------------------------------------------------------------------------------------------------------
Predicate Information (identified by operation id):
---------------------------------------------------
   6 - filter("T1"."D_DATE"<TO_DATE(' 2019-03-20 00:00:00', 'syyyy-mm-dd hh24:mi:ss') AND
	      "T1"."D_DATE">=TO_DATE(' 2019-03-01 00:00:00', 'syyyy-mm-dd hh24:mi:ss'))
19 rows selected.
--t2表,老环境
PLAN_TABLE_OUTPUT
------------------------------------------------------------------------------------------------------------------------
Plan hash value: 2098670336
---------------------------------------------------------------------------------------------
| Id  | Operation		     | Name	    | Rows  | Bytes | Cost (%CPU)| Time     |
---------------------------------------------------------------------------------------------
|   0 | SELECT STATEMENT	     |		    |	  1 |	 13 |  3076   (1)| 00:00:37 |
|   1 |  SORT AGGREGATE 	     |		    |	  1 |	 13 |		 |	    |
|   2 |   TABLE ACCESS BY INDEX ROWID| TP2	    |  6094 | 79222 |  3076   (1)| 00:00:37 |
|*  3 |    INDEX RANGE SCAN	     | TP2_IND_DATE |  6094 |	    |	 18   (0)| 00:00:01 |
---------------------------------------------------------------------------------------------
PLAN_TABLE_OUTPUT
------------------------------------------------------------------------------------------------------------------------
Predicate Information (identified by operation id):
---------------------------------------------------
   3 - access("T1"."D_DATE">=TO_DATE(' 2019-03-01 00:00:00', 'syyyy-mm-dd
	      hh24:mi:ss') AND "T1"."D_DATE"<TO_DATE(' 2019-03-20 00:00:00', 'syyyy-mm-dd
	      hh24:mi:ss'))
17 rows selected.
--表数据,均为以下
SQL> select count(*),sum(id) from tp2 t1 where
t1.d_date>=to_date('2019/03/1','yyyy/mm/dd') and
t1.d_date<to_date('2019/03/20','yyyy/mm/dd');
  COUNT(*)    SUM(ID)
---------- ----------
      6278  313589166
检查表及索引相关信息:
--表相关信息
OWNER	 TABLE_NAME	 OBJECT_TYPE	  size_g  STATUS   DEGREE	   LAST_ANAL CREATED
------------------- ---------------- ------------------------   ------------- --------
MYTEST	 TP1		 TABLE			 .390625 VALID	    4	       02-APR-20 02-APR-20
MYTEST	 TP2		 TABLE			 .390625 VALID	    4	       02-APR-20 02-APR-20
--索引
OWNER			       INDEX_NAME		      S.BYTES/1024/1024/1024 LAST_ANAL CLUSTERING_FACTOR CREATED
------------------------------ ------------------------------ ---------------------- --------- ----------------- ---------
MYTEST			       TP2_IND_DATE				  .002929688 02-APR-20		   50153 02-APR-20
MYTEST			       TP1_IND_DATE				  .002929688 02-APR-20		   99822 02-APR-20
通过以上,发现,主要差异在索引集群引子上,那么什么会引起集群引子高呢,索引所对应的列比较无序或散,如果不回表,只是查询索引列没有影响,如果需要回表,索引所对应列会反复读取块中数据,大致类似如下:
如上图所示,如果我要查询2-5行数据,索引范围扫描,按照顺序扫描(索引三个块,表三个块),2找表块2,3找表块1,4找表块3,5又找表块1. 表块1需要被反复读取,造成资源尤其io资源浪费。
如果良好的表和索引结构如下
我们大概知道原因了,那么怎么形成的呢?
并行查询。正常时间列,一般按照时间顺序写入,或更新(更新可能会有出入),写入是顺序写入,那么在该列上创建索引,效果相对可以。如果并行呢,就是本来一个块上的数据,根据并行度,到目标端可能是多个块,例如并行度为4,原来这个块上就有4行有序数据,到了目标端变成了4个块,以此类推。
我们看一下两张表部分数据块分布情况对比,对比如下:
DATE_PER_D t1blk_count t2blk_count  t1-t2_blk
---------- ----------- ----------- ----------
2019/03/11	   314	       157	  157
2019/03/12	   305	       153	  152
2019/03/13	   339	       170	  169
2019/03/14	   358	       179	  179
2019/03/15	   322	       162	  160
2019/03/16	   345	       174	  171
2019/03/17	   337	       169	  168
2019/03/18	   341	       172	  169
2019/03/19	   343	       173	  170
通过上边可以发现,同样的数据,例如3月11日这一天的数据,tp1列d_date分布在214个块,tp2分布在157个块。数据库会自动选择相对效果更好的执行计划,因此会出现两个相同表,索引计划不同的情况。 相关测试语句及环境如下:
create table tp1 (id int,vid varchar2(4000),d_date date);
create table tp2 (id int,vid varchar2(4000),d_date date);
--随时生成日期,等相关数据
declare
  i int := 0;
begin
for i in 1 .. 100000 loop
insert into tp1 values(i,i||'_'||rpad('*','2990','*'),(select to_date('2019/'||trunc(DBMS_RANDOM.VALUE(1, 12))||'/'||trunc(DBMS_RANDOM.VALUE(1, 28)), 'yyyy/mm/dd') from dual));
end loop;
commit;
end;
--插入相关数据,并开启并行,tp2 模拟顺序写入
insert into tp2 select * from tp1 order by d_date;
alter table tp1 parallel 4;
alter table tp2 parallel 4;
--创建索引,收集统计信息
create index tp1_ind_date on tp1(d_date);
create index tp2_ind_date on tp2(d_date);
exec dbms_stats.gather_table_stats('MYTEST','TP1',degree => 4,cascade => true);
exec dbms_stats.gather_table_stats('MYTEST','TP2',degree => 4,cascade => true);
--查看块分布,根据rowid,rowid18位,对象号6+文件号3+块号6+行号3
select to_char(t1.d_date,'yyyy/mm/dd') date_per_D,count(distinct lpad(t1.rowid,15)) as "t1blk_count",count(distinct lpad(t2.rowid,15)) as "t2blk_count" ,
count(distinct lpad(t1.rowid,15))-count(distinct lpad(t2.rowid,15)) as "t1-t2_blk" from tp1 t1,tp2 t2
where to_char(t1.d_date,'yyyy/mm/dd')=to_char(t2.d_date,'yyyy/mm/dd') and t1.d_date>=to_date('2019/03/11','yyyy/mm/dd')
and t1.d_date<to_date('2019/03/20','yyyy/mm/dd') group by to_char(t1.d_date,'yyyy/mm/dd') order by 1;
--查看表大小
set lines 200
set pages 999
select t.owner,t.table_name,o.object_type,s.bytes/1024/1024/1024,t.status,t.DEGREE,t.LAST_ANALYZED,o.created
from dba_tables t ,dba_objects o ,dba_segments s where (t.table_name=o.object_name and o.object_name=s.segment_name)
and t.owner='MYTEST'  and t.table_name like 'TP%';
--查看索引
select d.owner,d.index_name,s.bytes/1024/1024/1024,d.LAST_ANALYZED,d.CLUSTERING_FACTOR,o.created from dba_indexes d,dba_segments s ,dba_objects o
where d.index_name=s.segment_name and d.index_name = o.object_name and d.owner='MYTEST'  and d.table_name like 'TP%' order by s.bytes desc;
上述只是模拟一个列的情况,一般而言,列多,索引多的情况下,至少有个索引的集群引子是比较好的。生产环境中,表大小为250g,无lob,不是分区。如果表调整为分区,效果会好很多。 附:Oracle成本选择示例:
--tp1 选择并行
 Access Path: TableScan
    Cost:  13786.68  Resp: 3829.63  Degree: 0
      Cost_io: 13786.00  Cost_cpu: 25181818
      Resp_io: 3829.44  Resp_cpu: 6994949
  Access Path: index (RangeScan)
    Index: TP1_IND_DATE
    resc_io: 6102.00  resc_cpu: 45832077
    ix_sel: 0.060943  ix_sel_with_filters: 0.060943
    Cost: 6103.24  Resp: 6103.24  Degree: 1
  Best:: AccessPath: TableScan
         Cost: 3829.63  Degree: 4  Resp: 3829.63  Card: 6094.28  Bytes: 0
--tp2  选择索引
Access Path: TableScan
    Cost:  13786.68  Resp: 3829.63  Degree: 0
      Cost_io: 13786.00  Cost_cpu: 25181818
      Resp_io: 3829.44  Resp_cpu: 6994949
  Access Path: index (RangeScan)
    Index: TP2_IND_DATE
    resc_io: 3075.00  resc_cpu: 24275478
    ix_sel: 0.060943  ix_sel_with_filters: 0.060943
    Cost: 3075.66  Resp: 3075.66  Degree: 1
  Best:: AccessPath: IndexRange
  Index: TP2_IND_DATE
         Cost: 3075.66  Degree: 1  Resp: 3075.66  Card: 6094.28  Bytes: 0


")


 RAC 详细操作过程")
