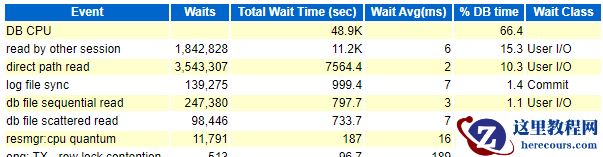
一、问题 实际生产程序,中午业务高峰的时候,购物车下单,订单查询,添加购物车超时,有些客户能成功,有些不能成功。其实业务请求不多。后台打出awr报告出来定位到了问题,是read by other session等待事件。
 找到对应的sql语句
 二、分析read by other session原因是一个session会话正在从磁盘把相同的数据块读到内存SGA时候,另外一些会话也同时请求相同数据块,数据块争用,这个瞬间的等待就是
read by other session。
解决办法:1.如果你把数据都缓存到了SGA,不需要从磁盘读这个数据,没有这个等待事件。
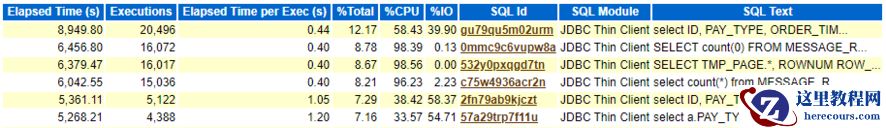
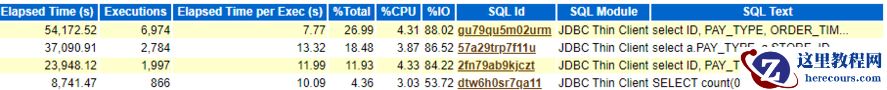
2.假如你一定要从磁盘读,那你加快这个sql的执行时间。看上面sql平均执行时间是0.44秒。而且每个sql都是针对表A(这里隐藏了真正表的名字,是实际生产库的)的相同行,查询语句都是针对表A的。
现在我来做一个数学题目:每条语句执行0.44秒,假设购物车下单一次需要执行如上sql语句2次,目前我有40个会话。那我1秒钟可以执行2.2次sql。针对同一行,不同会话,1秒钟1个会话只能有2.2次查询,超过这个数,如果每次都要从磁盘读数据,那就会发生
read by other session等待。发生如上情况有同时满足如下条件:
(1)查询 针对同一表的同一行,才会有同一个数据块争用。
(2)要从磁盘读数据,不能直接从缓存拿,如果从缓存拿,不会发生
read by other session等待事件 (3)要争用,并发请求会话要多如果这个语句执行时间是0.01秒,那么1秒钟执行100次这个语句。分析如下关键语句:
二、分析read by other session原因是一个session会话正在从磁盘把相同的数据块读到内存SGA时候,另外一些会话也同时请求相同数据块,数据块争用,这个瞬间的等待就是
read by other session。
解决办法:1.如果你把数据都缓存到了SGA,不需要从磁盘读这个数据,没有这个等待事件。
2.假如你一定要从磁盘读,那你加快这个sql的执行时间。看上面sql平均执行时间是0.44秒。而且每个sql都是针对表A(这里隐藏了真正表的名字,是实际生产库的)的相同行,查询语句都是针对表A的。
现在我来做一个数学题目:每条语句执行0.44秒,假设购物车下单一次需要执行如上sql语句2次,目前我有40个会话。那我1秒钟可以执行2.2次sql。针对同一行,不同会话,1秒钟1个会话只能有2.2次查询,超过这个数,如果每次都要从磁盘读数据,那就会发生
read by other session等待。发生如上情况有同时满足如下条件:
(1)查询 针对同一表的同一行,才会有同一个数据块争用。
(2)要从磁盘读数据,不能直接从缓存拿,如果从缓存拿,不会发生
read by other session等待事件 (3)要争用,并发请求会话要多如果这个语句执行时间是0.01秒,那么1秒钟执行100次这个语句。分析如下关键语句:
select ID, PAY_TYPE, ORDER_TIME, TOTAL_PAYABLE_AMOUNT, ACTUAL_PAY_AMOUNT, CURRENCY, AGGREGATE_ORDER_STATE, COMMENT_ORDER_STATE, REFUND_ORDER_STATE, CREATE_TIME, UPDATE_TIME, DEL_STATE, VERSION, USER_ID,
STORE_ID, BUSINESS_ORDER_ID, A_NO, REMARK, SHOW_URL, BUSINESS_LINE, MERCHANT_NO, BUSINESS_ORDER_STATE, STORE_NAME, BASIC_AMOUNT, CHANGE_NO_TIMES, PAY_ORDER_NO, BUSINESS_CONTENT, DEVICE_ID,
 NOT_CHECK_AMOUNT from A where A_NO = :1
非常简单的一个单表查询,查询有30个列。加索引优化这个语句就可以。
SELECT count(0) FROM A a LEFT JOIN p p ON (a.pay_order_no = p.pay_order_no) WHERE a.DEL_STATE = 10 AND a.USER_ID = :userid AND a.BUSINESS_LINE = :buline;
pnh_primary_。。。@LIFEKH>SELECT count(0) FROM A a LEFT JOIN p p ON (a.pay_order_no = p.pay_order_no) WHERE a.DEL_STATE = 10 AND a.USER_ID = :userid AND a.BUSINESS_LINE = :buline;
  COUNT(0)
----------
	 0
Execution Plan
----------------------------------------------------------
Plan hash value: 3179731160
--------------------------------------------------------------------------------------
| Id  | Operation	   | Name	     | Rows  | Bytes | Cost (%CPU)| Time     |
--------------------------------------------------------------------------------------
|   0 | SELECT STATEMENT   |		     |	   1 |	  31 | 16333   (1)| 00:03:16 |
|   1 |  SORT AGGREGATE    |		     |	   1 |	  31 |		  |	     |
|*  2 |   TABLE ACCESS FULL| A  |	   2 |	  62 | 16333   (1)| 00:03:16 |
--------------------------------------------------------------------------------------
Predicate Information (identified by operation id):
---------------------------------------------------
   2 - filter("A"."USER_ID"=:USERID AND "A"."BUSINESS_LINE"=:BULINE AND
	      "A"."DEL_STATE"=10)
Statistics
----------------------------------------------------------
	  1  recursive calls
	  0  db block gets
      60091  consistent gets
	  2  physical reads
	  0  redo size
	525  bytes sent via SQL*Net to client
	520  bytes received via SQL*Net from client
	  2  SQL*Net roundtrips to/from client
	  0  sorts (memory)
	  0  sorts (disk)
	  1  rows processed
你看执行计划中有2 physical reads, 去从磁盘读,加上索引不需要去磁盘读,就不会有等待事件
三、另外一个案例,也是非常典型:
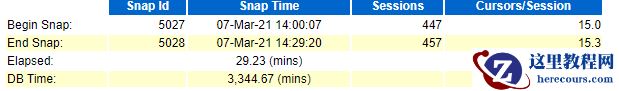
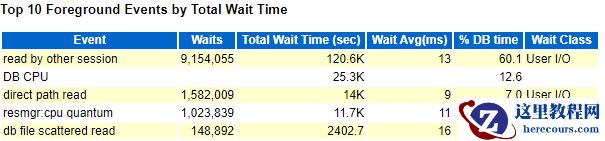
 负载是3344/29=100,数据库负载很高,执行sql语句效率非常低了,全部都在等待
read by other session,还同时出现
direct path read ,遇到非常典型的例子了
负载是3344/29=100,数据库负载很高,执行sql语句效率非常低了,全部都在等待
read by other session,还同时出现
direct path read ,遇到非常典型的例子了
Solutions
Excessive waits for this event are typically due to several processes repeatedly reading the same blocks, e.g. many sessions scanning the same index or performing full table scans on the same table.
1. Tune the SQL statement so that it reads fewer blocks. If the top objects listed in SolarWinds DPA are indexes, determine if there is a more efficient index that can be used more efficiently. If the top objects are tables, a full table scan or index randge scan is being performed. Look for efficient indexing opporunties.
1. Increase the buffer cache so that more blocks are already in memory rather having to be read from disk. The query will still need to read the same number of blocks so tuning is the first recommendation, but if you cannot tune the statement, a query reading blocks from memory is much faster than from disk.
1. Increase the PCTUSED / PCTFREE for the table storage parameters via ALTER TABLE or rebuild. This will result in less rows per block and possibly reduce contention.


![[oracle] 索引低效,导致read by other session等待事件](https://www.herecours.com/d/file/efpub/2026/03-03/20260303151531841710.jpg "[oracle] 索引低效,导致read by other session等待事件")


