Prometheus将数据采集和报警分成了两个模块。报警规则配置在Prometheus Servers上,然后发送报警信息到AlertManger,然后我们的AlertManager就来管理这些报警信息,聚合报警信息过后通过email、PagerDuty、HipChat、Slack 等方式发送消息提示。本文演示通过email发送告警信息。
如下为在prometheus已经部署好的情况下,配置Alertmanager邮件发送。
一、安装Altermanager软件
下载地址为https://prometheus.io/download/
我选择最新的alertmanager-0.23.0.linux-amd64.tar.gz 压缩包。上传并解压
[root@ysl ~]# tar -xf alertmanager-0.23.0.linux-amd64.tar.gz
[root@ysl ~]# ll alertmanager-0.23.0.linux-amd64
total 53596
-rwxr-xr-x 1 3434 3434 30942810 Aug 25  2021 alertmanager
-rw-r--r-- 1 3434 3434      348 Aug 25  2021 alertmanager.yml
-rwxr-xr-x 1 3434 3434 23913946 Aug 25  2021 amtool
-rw-r--r-- 1 3434 3434    11357 Aug 25  2021 LICENSE
-rw-r--r-- 1 3434 3434      457 Aug 25  2021 NOTICE
启动alertmanager
[root@ysl ~]# nohup /root/alertmanager-0.23.0.linux-amd64/alertmanager --config.file=/root/alertmanager-0.23.0.linux-amd64/alertmanager.yml > /root/alertmanager-0.23.0.linux-amd64/alertmanager.log 2>&1 &
[1] 26176
[root@ysl ~]# ps -ef | grep alert
root      26176  26070  0 11:58 pts/1    00:00:00 /root/alertmanager-0.23.0.linux-amd64/alertmanager --config.file=/root/alertmanager-0.23.0.linux-amd64/alertmanager.yml
root      26443  26070  0 11:59 pts/1    00:00:00 grep --color=auto alert
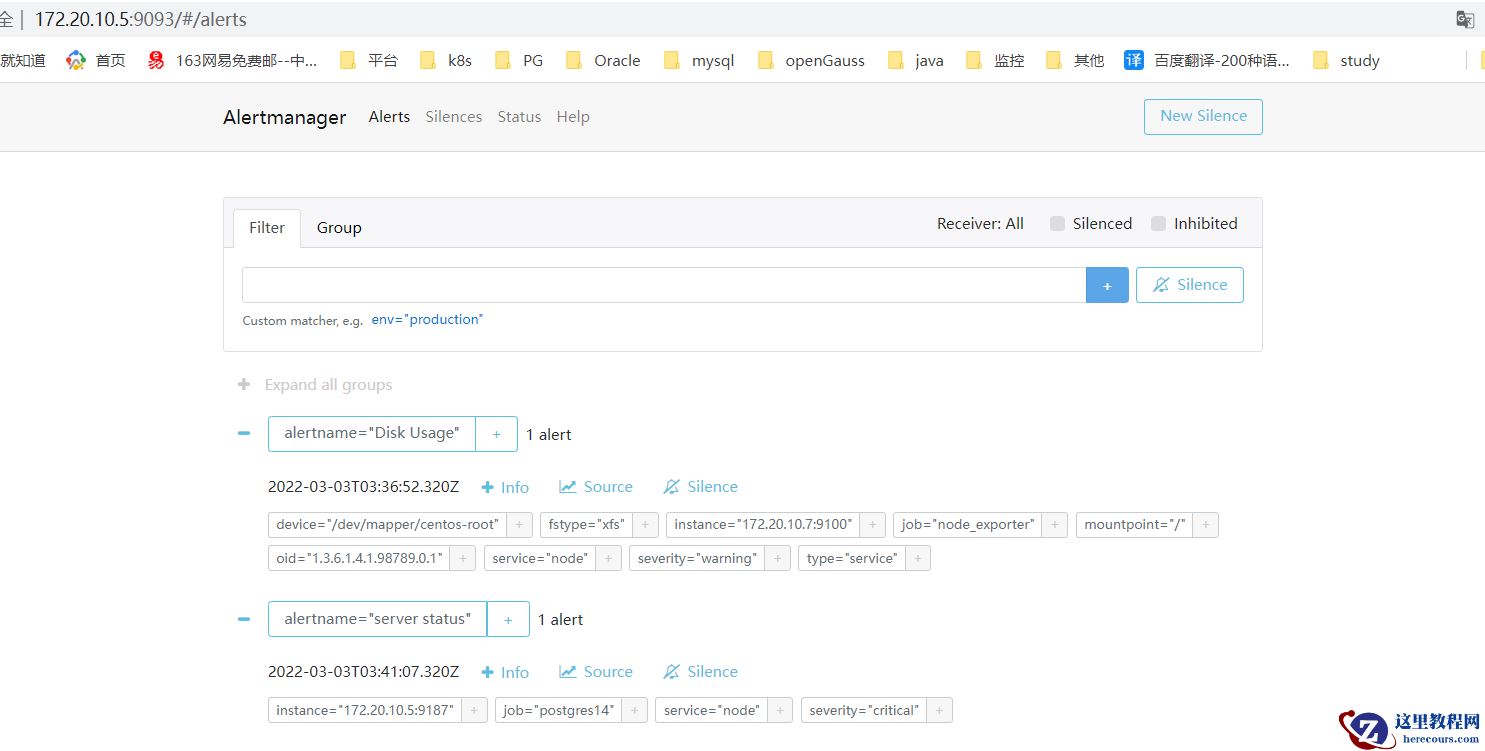
浏览器访问9093端口
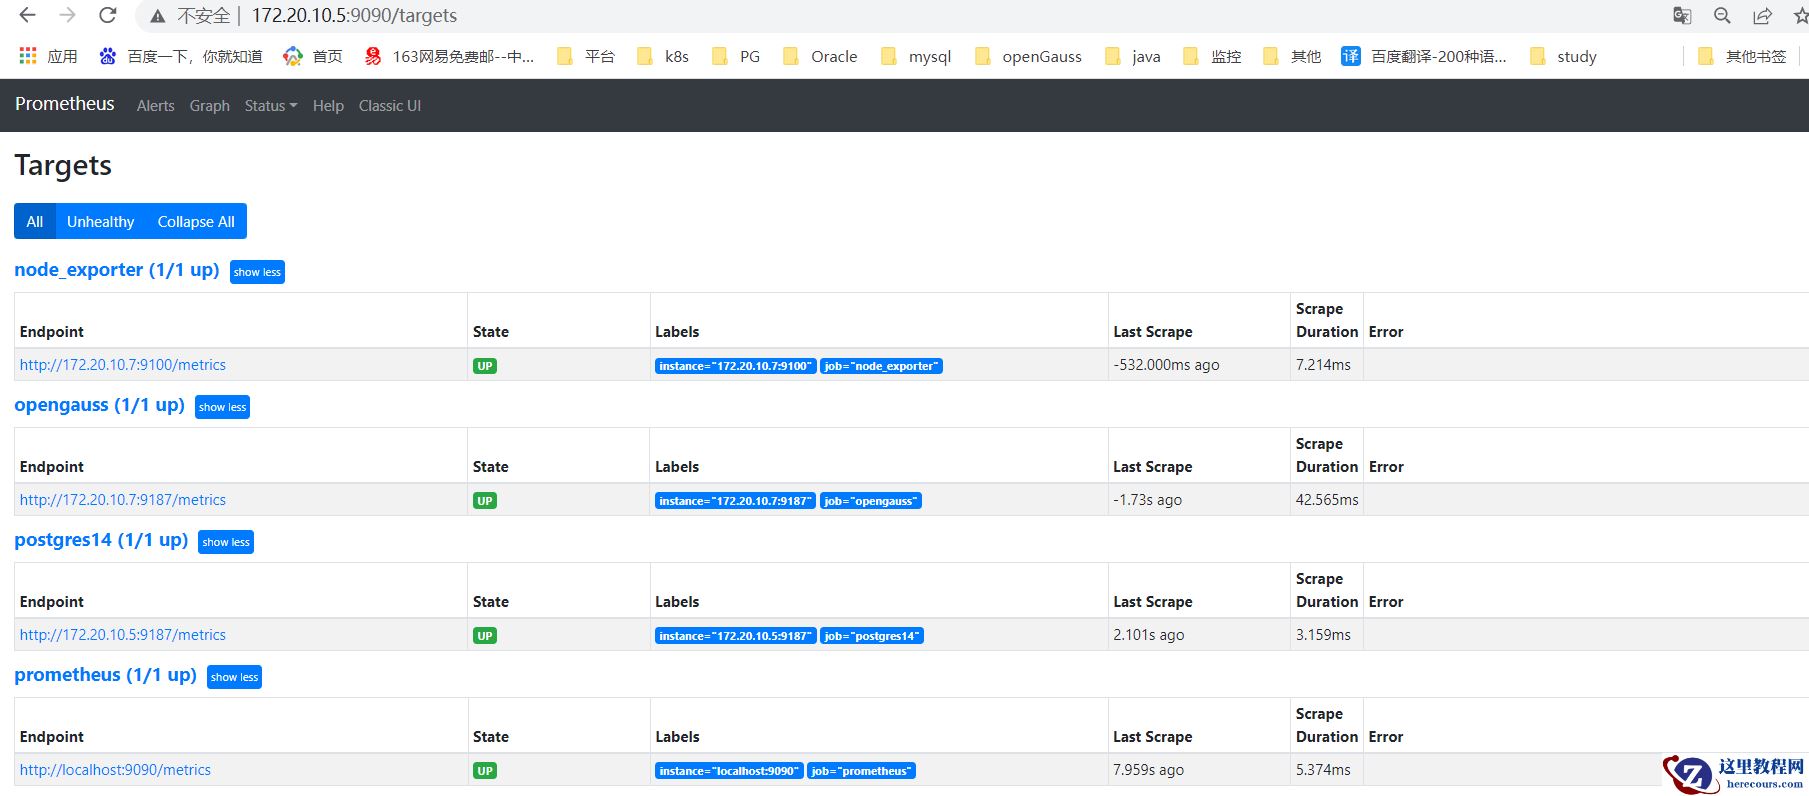
二、添加到Prometheus管理
把alertmanager添加到prometheus的配置里
alerting:
  alertmanagers:
    - static_configs:
        - targets:
           - 172.20.10.5:9093
rule_files:
- "rules/*.yml"
告警规则读取prometheus目录的rule下的所有以yml结尾的文件
创建rule目录并规定告警项,并定义报警邮件格式,这里制定了一个实例状态和磁盘的告警。
[root@ysl prometheus]# ll rules/
total 4
-rw-r--r-- 1 root root 794 Mar  2 11:37 rule1.yml
[root@ysl prometheus]# cat rules/rule1.yml
    # metrics_path defaults to '/metrics'
groups:
    - name: node_rule
      rules:
      - alert: server status
        expr: up == 0
        for: 10s
        labels:
          severity: critical
          service: node
        annotations:
          summary: "{{$labels.instance}}: instance down"
          description: "{{$labels.instance}}: instance down"
      - alert: Disk Usage
        expr: 100-(node_filesystem_free_bytes{fstype=~"ext4|xfs"}/node_filesystem_size_bytes {fstype=~"ext4|xfs"}*100) > 50
        for: 1m
        labels:
          severity: warning
          type: "service"
          service: node
          oid: "1.3.6.1.4.1.98789.0.1"
        annotations:
          summary: "Disk used too high"
          description: "Service {{ $labels.instance}} : {{$value}}%)"
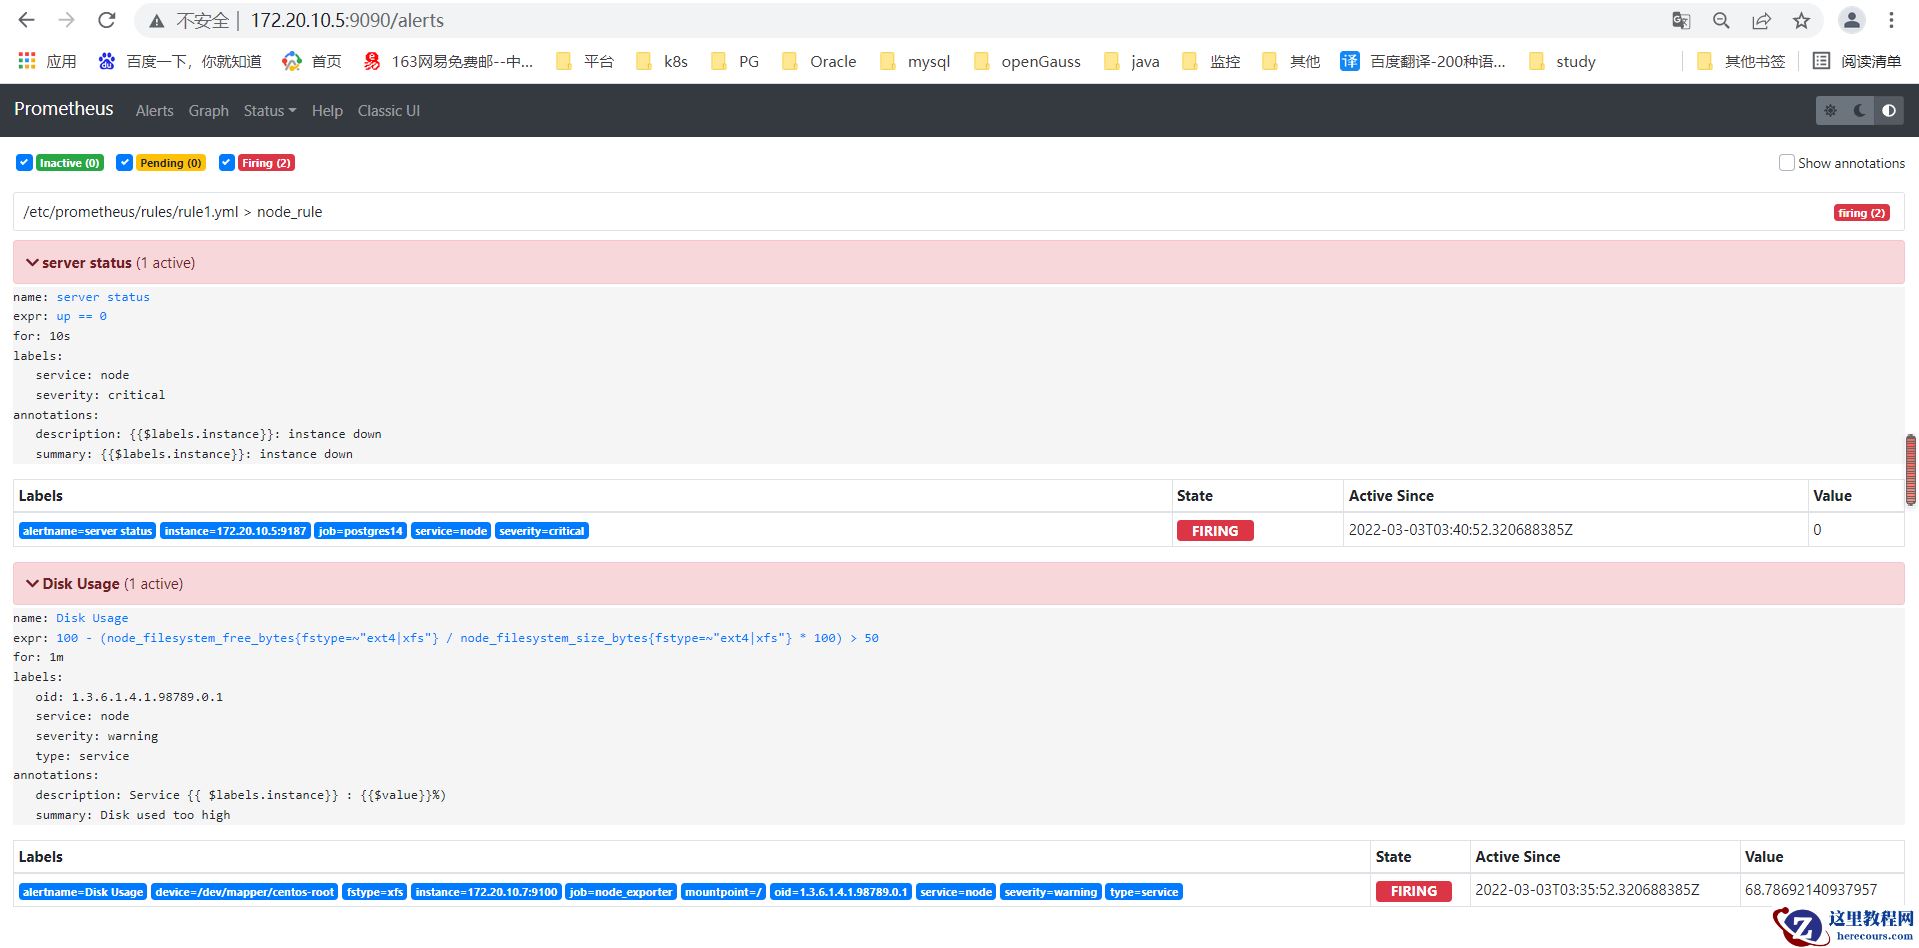
重启prometheus生效,prometheus的alerts下可以看到对应的两个告警。
三、配置告警邮件发送
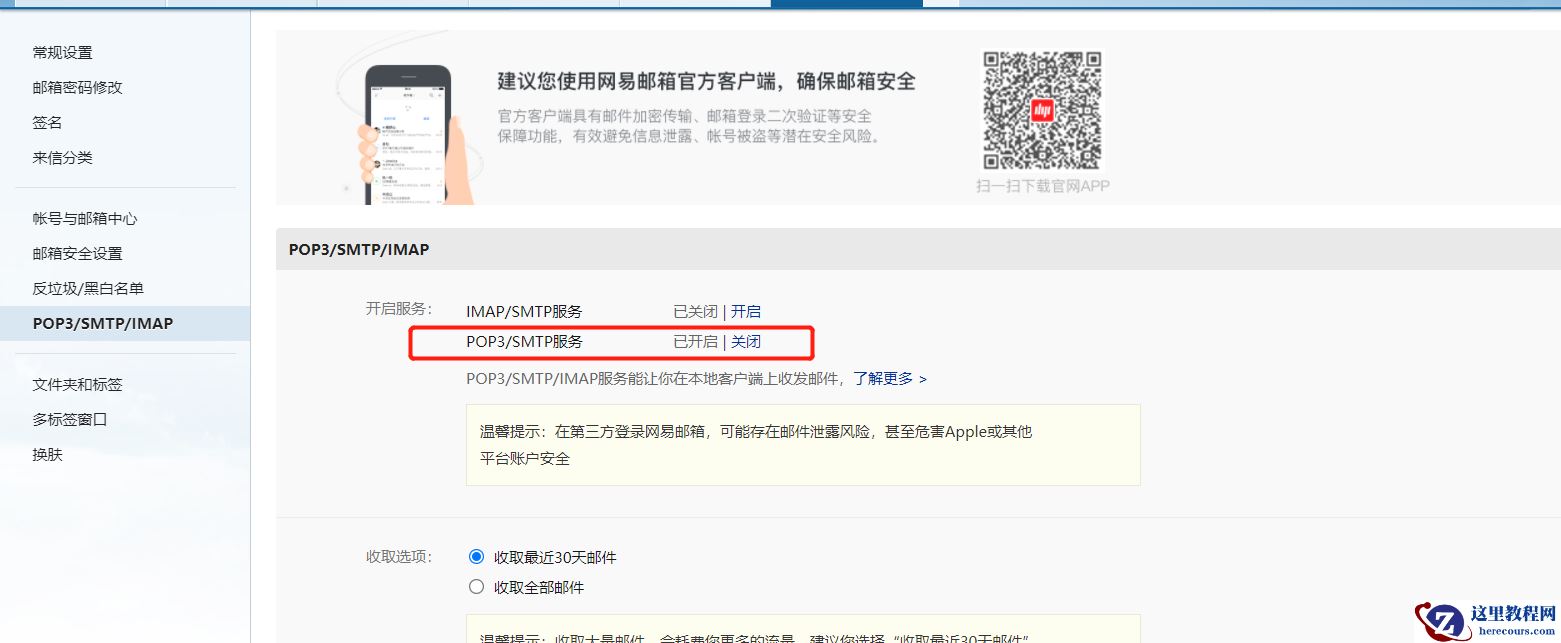
编辑alertmanager.yml文件,定义发送邮箱,这里举例为163邮箱
global:
  resolve_timeout: 5m
  smtp_from: '12345678@163.com'
  smtp_smarthost: 'smtp.163.com:465'
  smtp_auth_username: '12345678@163.com'
  smtp_auth_password: 'BPAOGHPPLGKBLYYNKFL'
  smtp_require_tls: false
  smtp_hello: '163.com'
route:
  group_by: ['alertname']
  group_wait: 5s
  group_interval: 5s
  repeat_interval: 5m
  receiver: 'email'
receivers:
- name: 'email'
  email_configs:
  - to: '12345678@163.com'
    send_resolved: true
inhibit_rules:
  - source_match:
      severity: 'critical'
    target_match:
      severity: 'warning'
    equal: ['alertname', 'dev', 'instance']
将邮箱替换,且替换smtp_auth_password,这个密码为邮箱开启POP3/SMTP服务的密码,不是邮箱登陆密码
重启服务
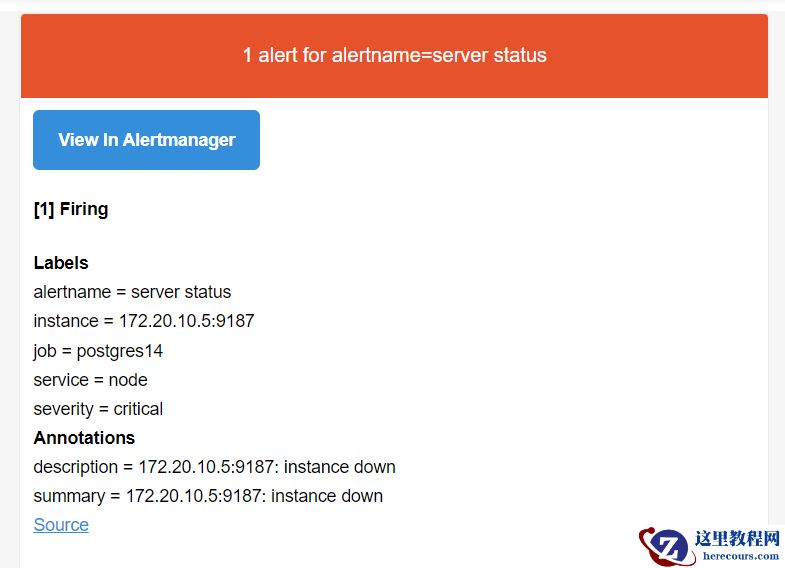
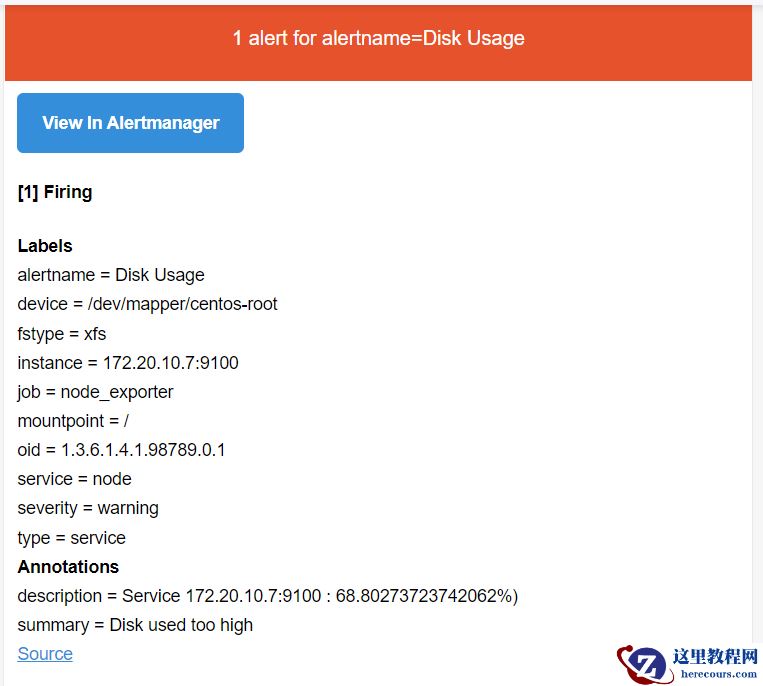
如果存在告警,则会发送邮件到邮箱
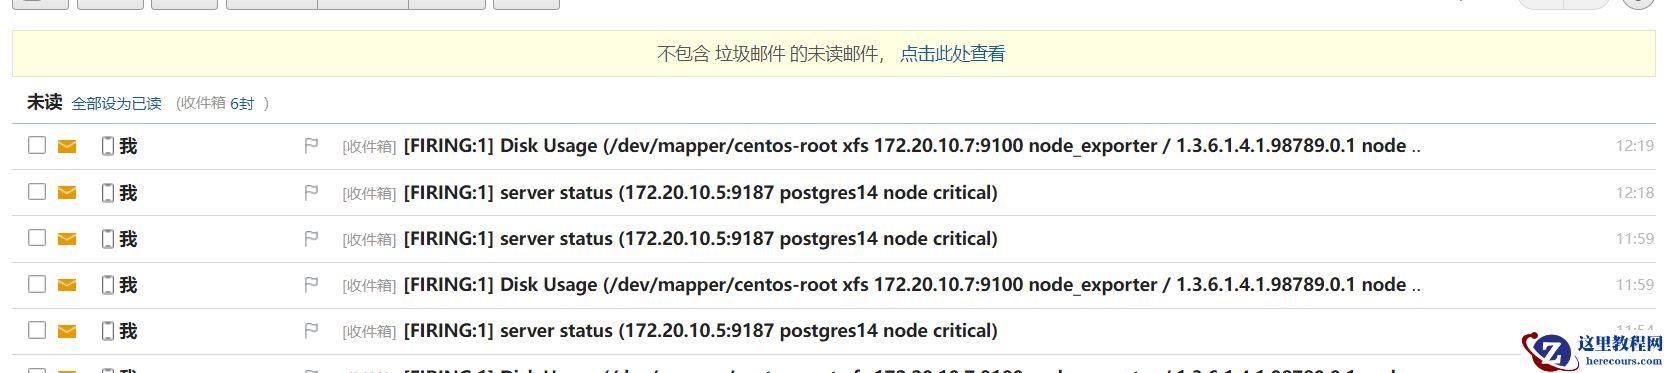
告警内容如图所示


")


")
测试框架方面的实践和突破")


