
[20211214]查看视图V$ACTIVE_SESSION_HISTORY遇到奇怪问题.txt --//生产系统遇到无法生成awr的问题,做一个分析: 1.环境: xxxxxx> @ver1 PORT_STRING VERSION BANNER ------------------------------ -------------- ---------------------------------------------------------------------------- x86_64/Linux 2.4.xx 11.2.0.3.0 Oracle Database 11g Enterprise Edition Release 11.2.0.3.0 - 64bit Production 2.分析: xxxxxx> select min(sample_time),max(sample_time),sysdate from V$ACTIVE_SESSION_HISTORY ; MIN(SAMPLE_TIME) MAX(SAMPLE_TIME) SYSDATE ----------------------- ----------------------- ------------------- 2012-10-26 08:19:21.466 2012-10-26 08:19:55.536 2021-12-14 17:20:18 --//MAX(SAMPLE_TIME) = 2012-10-26 08:19:55.536 , 而当前时间是2021-12-14 17:20:18。 xxxxxx> @ bg mm ADDR PID SPID PROGRAM ---------------- ------- ------ -------------------------- 00000000BD799A00 9 3618 oracle@xhserver (MMAN) 00000000BD79FE20 15 3630 oracle@xhserver (MMON) 00000000BD7A0ED0 16 3632 oracle@xhserver (MMNL) --//很明显收集ash停止收集信息,什么原因造成的问题呢? xxxxxx> SELECT * FROM DBA_HIST_SNAPSHOT WHERE snap_id IN (SELECT MAX (snap_id) FROM DBA_HIST_SNAPSHOT) 2 @pr ============================== SNAP_ID : 60089 DBID : 252262230 INSTANCE_NUMBER : 1 STARTUP_TIME : 2012-10-26 08:06:15.000 BEGIN_INTERVAL_TIME : 2021-12-05 12:00:21.235 END_INTERVAL_TIME : 2021-12-05 13:00:24.355 FLUSH_ELAPSED : +00000 00:00:00.1 SNAP_LEVEL : 1 ERROR_COUNT : 0 SNAP_FLAG : 0 SNAP_TIMEZONE : +0 08:00:00 PL/SQL procedure successfully completed. --// 2021-12-05 13:00:24.355停止了,从来没有遇到这个问题。为什么呢? --// 再次看STARTUP_TIME发现一个奇特现象时间指向了2012-10-26 08:06:15.000,不应该这么长时间启动数据库而没有关库。 --// 也就服务器发生了重启,并且服务器的时钟走的不对. # hwclock ;date Sun 04 Nov 2012 10:36:20 AM CST -0.000513 seconds Tue Dec 14 17:30:23 CST 2021 --//机器硬件的时间与服务器存在巨大差异。检查alert*.log 发现:(补充实际上重启了2次) --//实际上第1次发生在2021/8/12 Thu Aug 12 11:59:35 2021 LNS: Standby redo logfile selected for thread 1 sequence 16387 for destination LOG_ARCHIVE_DEST_2 Fri Oct 26 08:05:58 2012 --//第1次重启数据库。 Starting ORACLE instance (normal) ****************** Large Pages Information ***************** Total Shared Global Region in Large Pages = 1522 MB (100%) Large Pages used by this instance: 761 (1522 MB) Large Pages unused system wide = 39 (78 MB) (alloc incr 16 MB) Large Pages configured system wide = 800 (1600 MB) Large Page size = 2048 KB *********************************************************** ... Fri Oct 26 08:10:46 2012 SMCO started with pid=85, OS id=5133 Thu Aug 12 15:18:04 2021 VKTM detected a time drift. Please check trace file for more details. VKTM detected a time drift. Please check trace file for more details. Thu Aug 12 15:19:16 2021 Starting background process CJQ0 Sun Dec 05 11:44:42 2021 ~~~~~~~~~~~~~~~~~~~~~~~~ LNS: Standby redo logfile selected for thread 1 sequence 17237 for destination LOG_ARCHIVE_DEST_2 Fri Oct 26 08:19:10 2012 --//第2次重启数据库。 ~~~~~~~~~~~~~~~~~~~~~~~ Starting ORACLE instance (normal) ****************** Large Pages Information ***************** Total Shared Global Region in Large Pages = 1522 MB (100%) Large Pages used by this instance: 761 (1522 MB) Large Pages unused system wide = 39 (78 MB) (alloc incr 16 MB) Large Pages configured system wide = 800 (1600 MB) Large Page size = 2048 KB *********************************************************** ....... Fri Oct 26 08:19:50 2012 db_recovery_file_dest_size of 41220 MB is 0.00% used. This is a user-specified limit on the amount of space that will be used by this database for recovery-related files, and does not reflect the amount of space available in the underlying filesystem or ASM diskgroup. Setting Resource Manager plan SCHEDULER[0x318F]:DEFAULT_MAINTENANCE_PLAN via scheduler window Setting Resource Manager plan DEFAULT_MAINTENANCE_PLAN via parameter Fri Oct 26 08:19:53 2012 Starting background process VKRM Fri Oct 26 08:19:53 2012 VKRM started with pid=20, OS id=3802 Sun Dec 05 15:13:58 2021 VKTM detected a time drift. Please check trace file for more details. VKTM detected a time drift. Please check trace file for more details. Sun Dec 05 15:14:25 2021 --//顺便说一下,我没有使用ntp服务,而是在crond里面加入: */20 * * * * root /usr/sbin/ntpdate 192.168.xxx.xx > /dev/null 2>&1 --//但是VKTM到Sun Dec 05 15:13:58 2021才报VKTM detected a time drift. Please check trace file for more details. # uptime 17:36:38 up 9 days, 2:25, 1 user, load average: 0.05, 0.11, 0.09 xxxxxx> select sysdate-9-17/24-25/24/60 from dual ; SYSDATE-9-2/24-25/2 ------------------- 2021-12-05 15:12:44 --//也就是大概2021-12-05 15:12:44上下, 服务器重启. --//查看/var/log/messages.1 文件,也可以 Dec 5 04:03:03 xhserver syslogd 1.4.1: restart. Oct 26 08:18:41 xhserver syslogd 1.4.1: restart. Oct 26 08:18:42 xhserver kernel: klogd 1.4.1, log source = /proc/kmsg started. ... --//可以大致猜测应该2021/12/5 某个时刻死机了,或者重启服务器.大致到了2021-12-05 15:13:XX重启动数据库。 --//我估计是异常重启,没有正常关闭数据库。 xxxxxx> select * from DBA_HIST_DATABASE_INSTANCE 2 @ pr ============================== DBID : 252262230 INSTANCE_NUMBER : 1 STARTUP_TIME : 2021-03-13 10:31:36.000 PARALLEL : NO VERSION : 11.2.0.3.0 DB_NAME : HRP430 INSTANCE_NAME : hrp430 HOST_NAME : xhserver LAST_ASH_SAMPLE_ID : 215975423 PLATFORM_NAME : Linux x86 64-bit ============================== DBID : 252262230 INSTANCE_NUMBER : 1 STARTUP_TIME : 2012-10-26 08:06:15.000 PARALLEL : NO VERSION : 11.2.0.3.0 DB_NAME : HRP430 INSTANCE_NAME : hrp430 HOST_NAME : xhserver LAST_ASH_SAMPLE_ID : 0 PLATFORM_NAME : Linux x86 64-bit ============================== DBID : 252262230 INSTANCE_NUMBER : 1 STARTUP_TIME : 2012-10-26 08:19:40.000 PARALLEL : NO VERSION : 11.2.0.3.0 DB_NAME : HRP430 INSTANCE_NAME : hrp430 HOST_NAME : xhserver LAST_ASH_SAMPLE_ID : 0 PLATFORM_NAME : Linux x86 64-bit PL/SQL procedure successfully completed. --//再次查看alert确实重启了2次。 --//结合前面的检查,可以发现2021-12-05 13:00:24.355 - 2021-12-05 15:13:58 (Sun Dec 05 15:13:58 2021) 之间死机或者重启了服 --//务器以及数据库. --//可以大致猜测几种情况 --//1.服务器的cmos电池已经没电了,导致服务器时间不正常. --//2.我记忆里linux服务器正常关闭,应该会执行一步服务器当前时间同步硬件时钟的操作,很明显没有这步.也就是死机的可能性很大, --// 关于一些细节要跟管理服务器的同事确认. --//3.我并不排除有人进入BIOS SETUP界面修改时间的可能,不过这个可能性很小。 --//剩下的如何解决这些问题: xxxxxx> @bgx mm PROGRAM MODULE ACTION SID PID SPID -------------------------- ------------ ------------- ------- ------ oracle@xhserver (MMAN) 417 9 3618 oracle@xhserver (MMNL) 4 16 3632 oracle@xhserver (MMON) 1246 15 3630 # ps -elf | grep -E "UI[D]|361[8]|363[0]|363[2]" F S UID PID PPID C PRI NI ADDR SZ WCHAN STIME TTY TIME CMD 0 S oracle 3618 1 0 78 0 - 58663 - Dec05 ? 00:00:00 ora_mman_hrp430 0 S oracle 3630 1 0 75 0 - 60125 - Dec05 ? 00:00:00 ora_mmon_hrp430 0 S oracle 3632 1 0 75 0 - 58957 - Dec05 ? 00:00:00 ora_mmnl_hrp430 # hwclock --systohc --debug hwclock from util-linux 2.13-pre7 Using /dev interface to clock. Last drift adjustment done at 1457145517 seconds after 1969 Last calibration done at 1457145517 seconds after 1969 Hardware clock is on UTC time Assuming hardware clock is kept in UTC time. Waiting for clock tick... ...got clock tick Time read from Hardware Clock: 2012/11/04 17:38:38 Hw clock time : 2012/11/04 17:38:38 = 1352050718 seconds since 1969 Time elapsed since reference time has been 0.516304 seconds. Delaying further to reach the new time. Setting Hardware Clock to 00:32:42 = 1639528362 seconds since 1969 ~~~~~~~~~~~~~~~~~~~~~~~~~~~~~~~~~~~~~~~~~~~~~~~~~~~~~~~~~~~~~~~~~ ioctl(RTC_SET_TIME) was successful. Not adjusting drift factor because it has been less than a day since the last calibration. --//注:加入--debug 主要看里面执行的细节。下划线表示什么不懂。视乎里面的32表示32天。 xxxxxx> select sysdate - timestamp'2012-11-04 17:38:38' from dual ; SYSDATE-TIMESTAMP'2012-11-0417:38:38' --------------------------------------------------------------------------- +000003327 14:58:35.000000000 # hwclock ; date Wed 15 Dec 2021 08:37:40 AM CST -0.000560 seconds Wed Dec 15 08:37:40 CST 2021 --//现在时间已经同步。 --//kill mmon,mmnl进程。 xxxxxx> alter system enable restricted session; System altered. # ps -elf | grep -E "UI[D]|361[8]|363[0]|363[2]" F S UID PID PPID C PRI NI ADDR SZ WCHAN STIME TTY TIME CMD 0 S oracle 3618 1 0 78 0 - 58663 - Dec05 ? 00:00:00 ora_mman_hrp430 xxxxxx> alter system disable restricted session; System altered. xxxxxx> @ bgx mm PROGRAM MODULE ACTION SID PID SPID -------------------------- ------------ ------- ---- ------- ------ oracle@xhserver (MMAN) 417 9 3618 oracle@xhserver (MMNL) 4 16 18968 oracle@xhserver (MMON) 1246 15 18966 xxxxxx> select min(sample_time),max(sample_time),sysdate from V$ACTIVE_SESSION_HISTORY ; MIN(SAMPLE_TIME) MAX(SAMPLE_TIME) SYSDATE ----------------------- ----------------------- ------------------- 2012-10-26 08:19:21.466 2021-12-15 08:41:19.991 2021-12-15 08:41:20 --//MAX(SAMPLE_TIME) = 2021-12-15 08:41:19.991 ,说明开始能收集ash信息。问题解决。 xxxxxx> select count(*) from V$ACTIVE_SESSION_HISTORY where sample_time>trunc(sysdate); COUNT(*) ---------- 737 --//继续分析: xxxxxx> select sql_opname,sql_id,count(*) from V$ACTIVE_SESSION_HISTORY where sample_time<=trunc(sysdate) group by sql_id,sql_opname order by 3 desc; SQL_OPNAME SQL_ID COUNT(*) --------------- ------------- ---------- 32 ALTER DATABASE 1h50ks4ncswfn 24 ~~~~~~~~~~~~~~~~~~~~~~~~~~~~~~~~~~~~~~~~~ SELECT f6cz4n8y72xdc 6 SELECT g0jvz8csyrtcf 3 ALTER DATABASE 92b382ka0qgdt 3 ~~~~~~~~~~~~~~~~~~~~~~~~~~~~~~~~~~~~~~~~ PL/SQL EXECUTE 02577v815yp77 2 SELECT 05uqdabhzncdc 1 SELECT 836b98xx998x3 1 PL/SQL EXECUTE cnq31548hb8un 1 SELECT 1p36ta7p3d7fu 1 PL/SQL EXECUTE 49s332uhbnsma 1 SELECT a1xgxtssv5rrp 1 SELECT 9dhn1b8d88dpf 1 13 rows selected. --//sql_id=1h50ks4ncswfn出现多次,而且SQL_OPNAME 是ALTER DATABASE。 xxxxxx> @ sql_id 1h50ks4ncswfn no rows selected view dba_hist_sqltext no rows selected --//上网直接查询1h50ks4ncswfn,https://www.xifenfei.com/tag/ora-01555 *** 2019-01-25 14:15:19.247 dbkedDefDump(): Starting incident default dumps (flags=0x2, level=3, mask=0x0) ----- Current SQL Statement for this session (sql_id=1h50ks4ncswfn) ----- ALTER DATABASE OPEN --//视乎这个命令对应的就是ALTER DATABASE OPEN。 $ sql_id.sh "ALTER DATABASE OPEN\0" sql_text = ALTER DATABASE OPEN\0 full_hash_value(16) = 2560c35ddf0cebbf181412c128cc71d4 hash_value(10) = 684487124 sql_id(32) = 1h50ks4ncswfn sql_id(32) = 1h50ks4ncswfn sql_id(32) = 1h50ks4ncswfn --//正确。 --//查询92b382ka0qgdt,视乎对应ALTER DATABASE MOUNT,我的测试对不上。 $ sql_id.sh "ALTER DATABASE MOUNT\0" sql_text = ALTER DATABASE MOUNT\0 full_hash_value(16) = c74c9f84f1d0a9d569fd9ec039ac9989 hash_value(10) = 967612809 sql_id(32) = 6mzcys0wut6c9 sql_id(32) = 6mzcys0wut6c9 sql_id(32) = 6mzcys0wut6c9 --//终于找到一个链接 https://www.experts-exchange.com/questions/28683309/Unable-to-startup-database.html LibraryObjectLock: Address=f6edd440 Handle=f69b40e0 Mode=N CanBeBrokenCount=1 Incarnation=1 ExecutionCount=1 User=f7bdefd0 Session=f7bdefd0 ReferenceCount=1 Flags=CNB/[0001] SavepointNum=556c8d0e LibraryHandle: Address=f69b40e0 Hash=940b3db9 LockMode=N PinMode=0 LoadLockMode=0 Status=VALD ObjectName: Name=ALTER DATABASE MOUNT --//这里的MOUNT前面有3个空格。 FullHashValue=3b4263a262865c96912c6814940b3db9 Namespace=SQL AREA(00) Type=CURSOR(00) Identifier=2483764665 OwnerIdn=0 Statistics: InvalidationCount=0 ExecutionCount=1 LoadCount=2 ActiveLocks=1 TotalLockCount=1 TotalPinCount=1 Counters: BrokenCount=1 RevocablePointer=1 KeepDependency=1 BucketInUse=0 HandleInUse=0 HandleReferenceCount=0 Concurrency: DependencyMutex=f69b4190(0, 1, 0, 0) Mutex=f69b4210(0, 20, 0, 0) Flags=RON/PIN/TIM/PN0/DBN/[10012841] WaitersLists: Lock=f69b4170[f69b4170,f69b4170] Pin=f69b4150[f69b4150,f69b4150] LoadLock=f69b41c8[f69b41c8,f69b41c8] Timestamp: Current=06-01-2015 12:49:18 HandleReference: Address=f69b4290 Handle=0 Flags=[00] LibraryObject: Address=eeff20b0 HeapMask=0000-0001-0001-0000 Flags=EXS[0000] Flags2=[0000] PublicFlags=[0000] ChildTable: size='16' Child: id='0' Table=eeff2f60 Reference=eeff29b8 Handle=f69b3e90 NamespaceDump: Parent Cursor: sql_id=92b382ka0qgdt parent=eeff2150 maxchild=1 plk=y ppn=n $ sql_id.sh "ALTER DATABASE MOUNT\0" sql_text = ALTER DATABASE MOUNT\0 full_hash_value(16) = 3b4263a262865c96912c6814940b3db9 hash_value(10) = 2483764665 sql_id(32) = 92b382ka0qgdt sql_id(32) = 92b382ka0qgdt sql_id(32) = 92b382ka0qgdt --//终于对上了。 --//实际上自己使用10046跟踪估计也可以获得,有计划尝试看看。 3.总结: --//很明显我们团队许多人根本不看awr报表。 --//另外该硬件应该到了替换的时间。
[20211214]查看视图V$ACTIVE_SESSION_HISTORY遇到奇怪问题.txt
来源:这里教程网
时间:2026-03-03 17:21:05
作者:
编辑推荐:
下一篇:
相关推荐
-

-
-
-
-
-
-
-
-
-
-
-
-
-
-

雷神推出 MIX PRO II 迷你主机:基于 Ultra 200H,玻璃上盖 + ARGB 灯效
2 月 9 日消息,雷神 (THUNDEROBOT) 现已宣布推出基于英
-

制造商 Musnap 推出彩色墨水屏电纸书 Ocean C:支持手写笔、第三方安卓应用
2 月 10 日消息,制造商 Musnap 现已在海外推出一款 Oce
热文推荐
- 「Oracle」客户端 PL/SQL DEVELOPER 安装使用

「Oracle」客户端 PL/SQL DEVELOPER 安装使用
26-03-03 - Oracle的过载保护-数据库资源限制
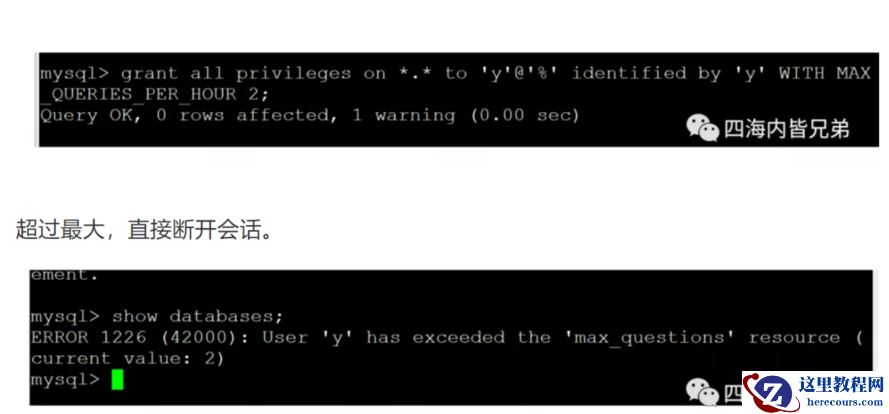
Oracle的过载保护-数据库资源限制
26-03-03 - 「Oracle」数据库字符集编码修改

「Oracle」数据库字符集编码修改
26-03-03 - 连上无线网却不能上网?为你解答

连上无线网却不能上网?为你解答
26-03-03 - databas如何避免重复故障
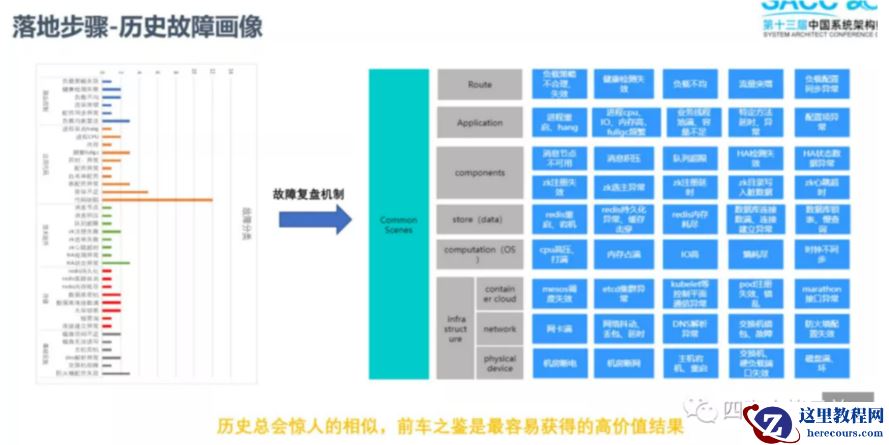
databas如何避免重复故障
26-03-03 - database(Oracle MySQL)查询速度和数据量有关系吗?
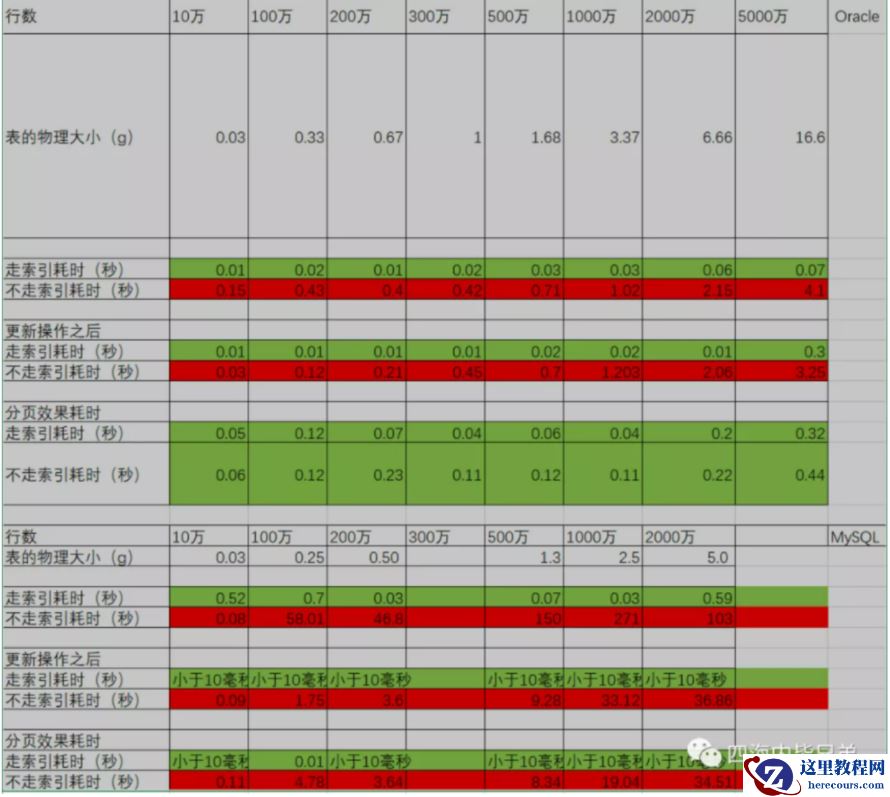
database(Oracle MySQL)查询速度和数据量有关系吗?
26-03-03 - Oracle clone database
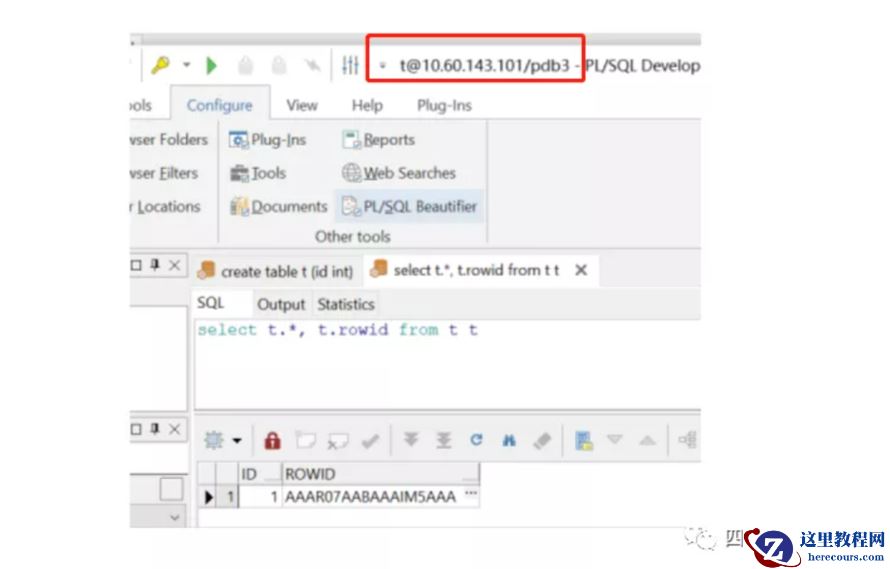
Oracle clone database
26-03-03 - 系统进程是什么?怎么通过系统进程进行病毒分析?

系统进程是什么?怎么通过系统进程进行病毒分析?
26-03-03 - Oracle意外发现PDB适合微服务和中台
Oracle意外发现PDB适合微服务和中台
26-03-03 - Oracle的特性分页
Oracle的特性分页
26-03-03