问题描述:
生产环境相同的inser语句在别的非.NET程序相应明显快于.NET程序,执行时间相差比较大,影响正常业务运行,测试环境反而正常。
问题详细诊断过程
问题初步判断诊断过程:
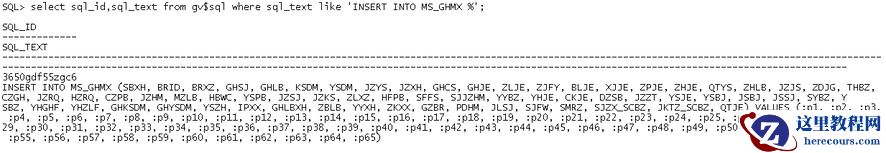
查询插入慢的sql_id
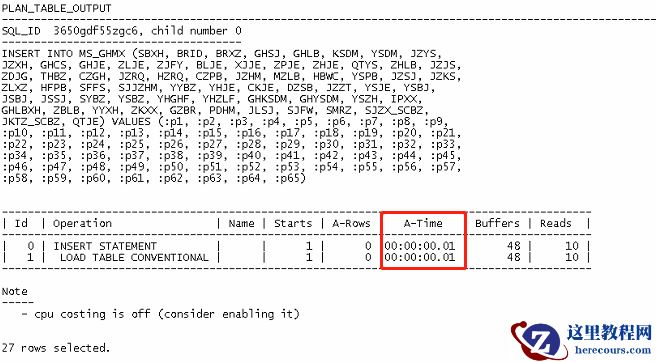
检查对应的执行计划,未发现异常,SQL A-TIME实际内部执行时间为1毫秒
 使用SQL trace跟踪insert数据库内部执行情况,总时间不到12毫秒
进一步对会话进行会话跟踪
使用SQL trace跟踪insert数据库内部执行情况,总时间不到12毫秒
进一步对会话进行会话跟踪
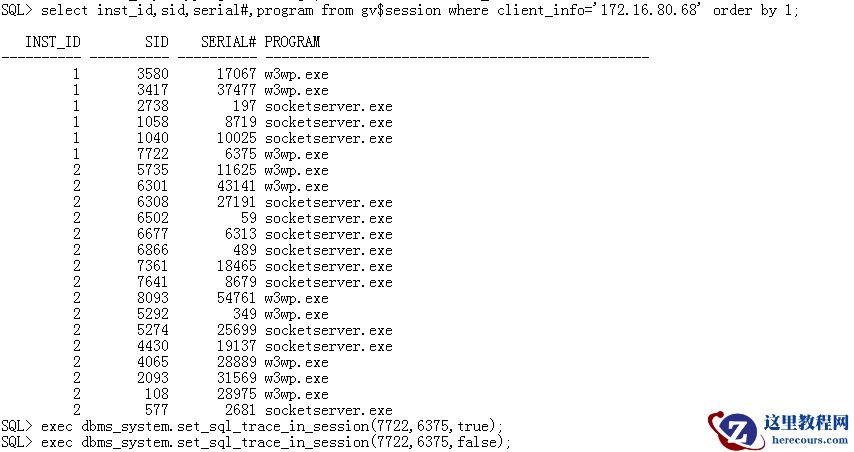 由于是3层架构,执行会话不固定,进行多次跟踪后并未发现有用信息。
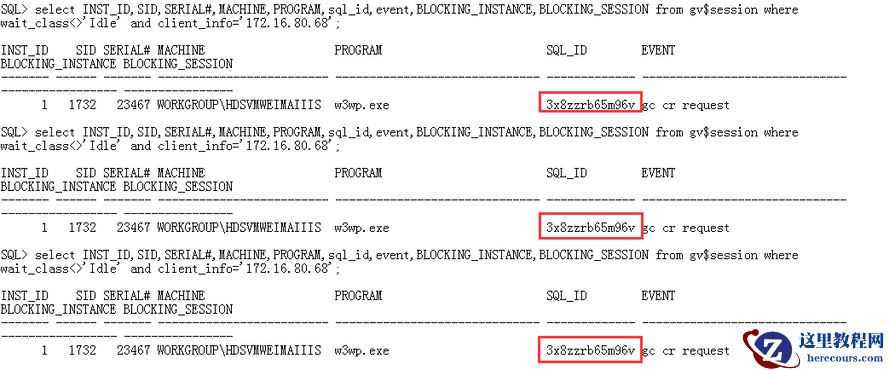
检查应用服务器的等待事件信息
由于是3层架构,执行会话不固定,进行多次跟踪后并未发现有用信息。
检查应用服务器的等待事件信息
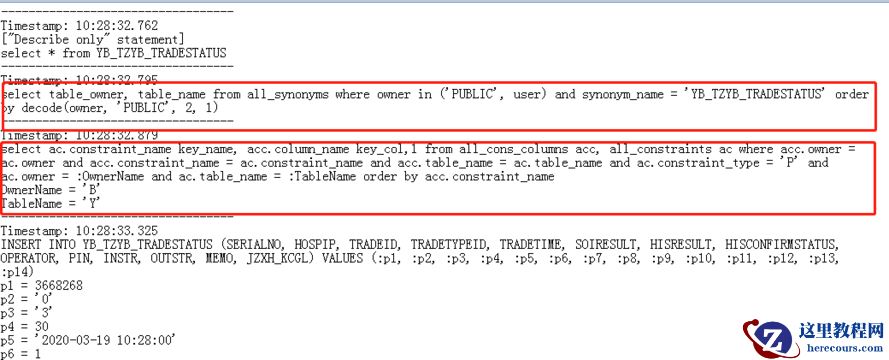
 进一步使用SQL monitor跟踪客户端,发现非业务SQL语句,内容如下:
根据客户端的ip及应用程序,后台数据库查询等待语句

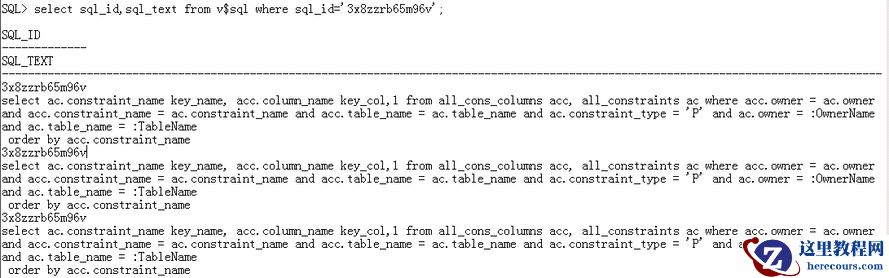
发现sql_id为'byvg6t5kz8xk0'的语句有等待现象,通过查询该sql语句
sql > select sql_text from v$sql where sql_id='byvg6t5kz8xk0';
select ac.constraint_name key_name, acc.column_name key_col,:"SYS_B_0" from all_cons_columns acc, all_constraints ac where acc.owner = ac.owner and acc.constraint_name = ac.constraint_name and acc.table_name = ac.table_name and ac.constraint_type = :"SYS_B_1" and ac.owner = :OwnerName and ac.table_name = :TableName order by acc.constraint_name
比较客户端抓取的语句,发现该语句在sqlmonitor中抓取的也存在,在插入数据前面有两条查询系统表的语句,实际上应用并没有执行这两条语句。
使用

对访问问题ip地址发起的IIS会话进行跟踪
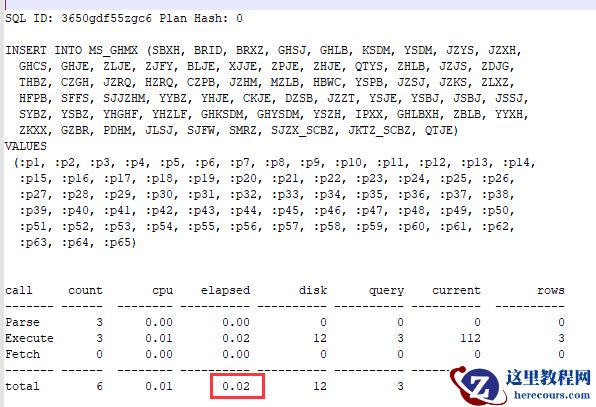
结果显示在跟踪时段内,一共解析与执行6次,总耗时0.02秒,进一步证实单独的插入过程在数据库内执行效率不存在异常。
在跟踪文件中,发现.net发起的查询系统all_synonyms和all_cons_columns、all_constraints关联表信息,这些系统查询也花费了不少时间,该多余查询也影响了客户端的返回时间,建议调整.net参数Cache Size的配置大小增加.net的缓存。
进一步分析
获取AWR、ash报告:
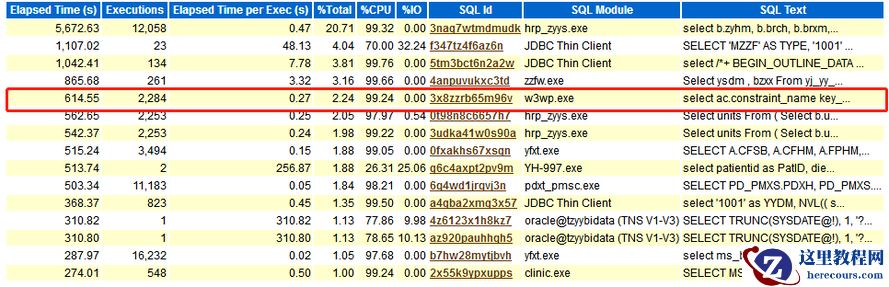
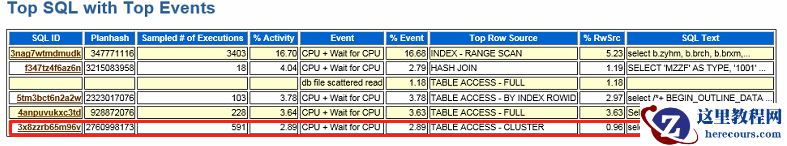
发现下面语句执行非常频繁
select ac.constraint_name key_name, acc.column_name key_col,:"SYS_B_0" from all_cons_columns acc, all_constraints ac where acc.owner = ac.owner and acc.constraint_name = ac.constraint_name and acc.table_name = ac.table_name and ac.constraint_type = :"SYS_B_1" and ac.owner = :OwnerName and ac.table_name = :TableName order by acc.constraint_name
查询Oracle官方文档,该SQL语句为.NET特性自动发起的语句,解释如下:
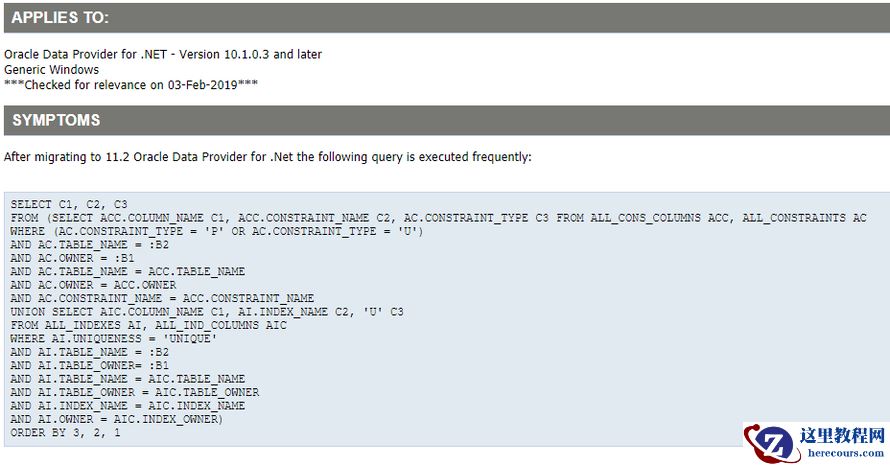
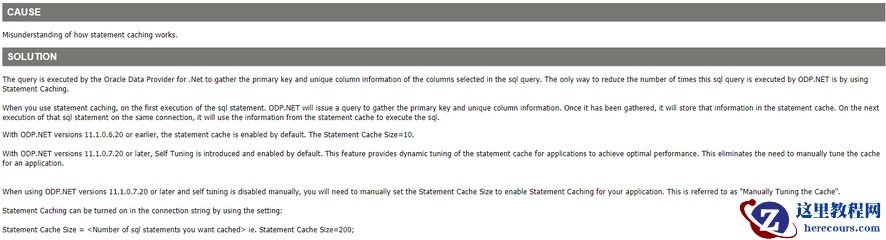
具体官方文档为Frequent Query on ALL_CONS_COLUMNS And ALL_CONSTRAINTS When Using ODP.Net Statement Caching (Doc ID 1386371.1),官方解释该语句确实为.NET自身发起,而非程序生成的语句。
解决办法为增加.NET端语句缓存,一次执行多次使用,调整Statement Cache Size=200
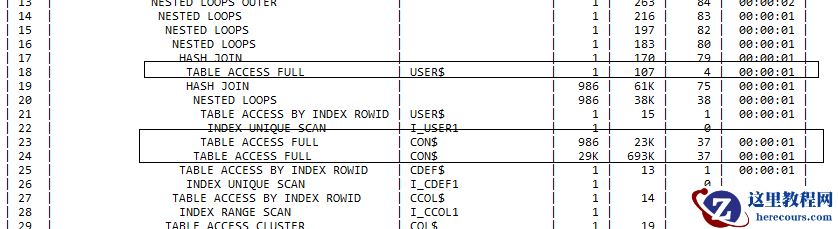
比较生产(有问题)和测试(正常)数据库的执行计划,下图为有异常的生产环境执行计划,走的是全表访问
下图为测试环境正常的执行计划,走的是索引
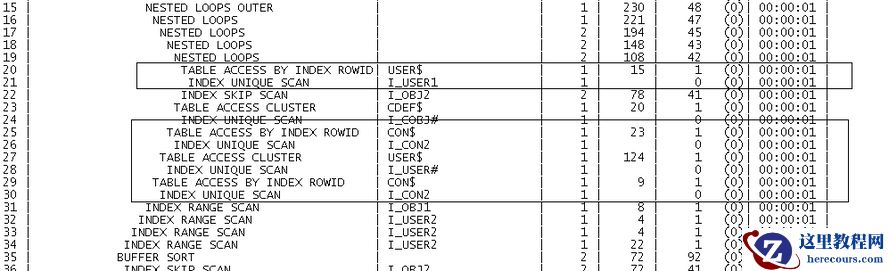
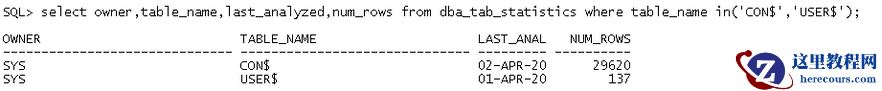
说明生产环境执行计划评估有问题,导致查询性能评估出错,检查统计基本统计信息:
通过10053跟踪,发现数据库确实选择了强制进行全表查询
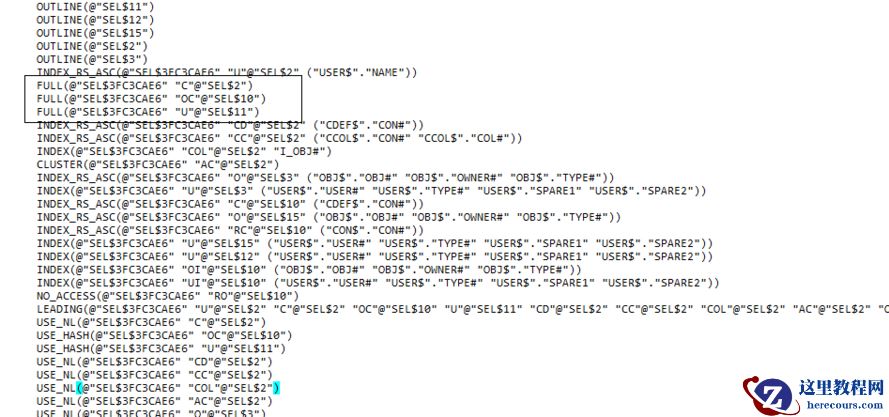
这说明走全表查询在数据库层面认为消耗比走索引低,查询使用列柱状信息
select a.owner,
a.table_name,
a.column_name,
b.num_rows,
a.num_distinct,
trunc(num_distinct / num_rows * 100, 2) selectivity,
'Need Gather Histogram' notice
from dba_tab_col_statistics a, dba_tables b
where a.owner = b.owner
and a.owner = '&1'
and a.table_name = '&2'
and a.table_name = b.table_name
AND ROUND(num_distinct * 100 / num_rows, 1) < 1
and (a.owner, a.table_name, a.column_name) in
(select r.name owner, o.name table_name, c.name column_name
from sys.col_usage$ u, sys.obj$ o, sys.col$ c, sys.user$ r
where o.obj# = u.obj#
and c.obj# = u.obj#
and c.col# = u.intcol#
and r.name = '&1'
and o.name = '&2')
and a.histogram = 'NONE';

关联使用到CON$所在列OWNER#,列的信息没有收集,依然使用默认选择度,选择了错误的执行路径。
方法一:对CON$所在列OWNER#做统计信息收集。
BEGIN
DBMS_STATS.GATHER_TABLE_STATS(ownname => 'SYS',
tabname => 'CON$',
estimate_percent => 100,
method_opt => 'for columns OWNER# size skewonly',
no_invalidate => FALSE,
cascade => TRUE);
END;
/
方法二:对查询的sql_id做SQLTUNE分析
DECLARE
sts_task VARCHAR2(64);
tname VARCHAR2(100);
sta_exists number;
BEGIN
SELECT count(*)
INTO sta_exists
FROM DBA_ADVISOR_TASKS
WHERE rownum = 1 AND
task_name = 'sql_t';
IF sta_exists = 1 THEN
SYS.DBMS_SQLTUNE.DROP_TUNING_TASK(
task_name=>'sql_t'
);
ELSE
DBMS_OUTPUT.PUT_LINE('SQL Tuning Task does not exist - will be created ...');
END IF;
tname := DBMS_SQLTUNE.CREATE_TUNING_TASK(
sql_id => '3x8zzrb65m96v',
plan_hash_value =>'2760998173',
time_limit => 360,
task_name => 'sql_t',
description => 'sql_id_al');
DBMS_SQLTUNE.EXECUTE_TUNING_TASK(
task_name => 'sql_t');
END;
/
查询优化建议,建议接受性能较好的sqlprofile:
SQL> set linesize 999 pagesize 0
SQL> SELECT DBMS_SQLTUNE.REPORT_TUNING_TASK(task_name=>'sql_t', section=>'FINDINGS', result_limit => 20) FROM DUAL;
GENERAL INFORMATION SECTION
------------------------------------------------------------------------------        Tuning Task Name : sql_t
Tuning Task Owner : SYS
Workload Type : Single SQL Statement
Scope : COMPREHENSIVE
Time Limit(seconds): 360
Completion Status : COMPLETED
Started at : 04/02/2020 16:30:07
Completed at : 04/02/2020 16:30:45
------------------------------------------------------------------------------
Schema Name: EMR
SQL ID : 3x8zzrb65m96v
SQL Text : select ac.constraint_name key_name, acc.column_name key_col,1
from all_cons_columns acc, all_constraints ac where acc.owner =
ac.owner and acc.constraint_name = ac.constraint_name and
acc.table_name = ac.table_name and ac.constraint_type = 'P' and
ac.owner = :OwnerName and ac.table_name = :TableName order by
acc.constraint_name
Bind Variables :
1 - (VARCHAR2(32)):BSRUN
2 - (VARCHAR2(32)):ZY_BQYZ_EXTEND
------------------------------------------------------------------------------
FINDINGS SECTION (1 finding)
------------------------------------------------------------------------------
1- SQL Profile Finding (see explain plans section below)
-------------------------------------------------------
A potentially better execution plan was found for this statement.
Recommendation (estimated benefit: 99.82%)
-----------------------------------------
Consider accepting the recommended SQL profile.        execute dbms_sqltune.accept_sql_profile(task_name => 'sql_t', task_owner
=> 'SYS', replace => TRUE);
Validation results
-----------------
The SQL profile was tested by executing both its plan and the original plan
and measuring their respective execution statistics. A plan may have been
only partially executed if the other could be run to completion in less time.
Original Plan With SQL Profile % Improved
------------ ---------------- ----------
Completion Status: COMPLETE COMPLETE
Elapsed Time (s): .309383 .006609 97.86 %
CPU Time (s): .308203 .006499 97.89 %
User I/O Time (s): 0 0
Buffer Gets: 86203 152 99.82 %
Physical Read Requests: 0 0
Physical Write Requests: 0 0
Physical Read Bytes: 0 0
Physical Write Bytes: 0 0
Rows Processed: 1 1
Fetches: 1 1
Executions: 1 1
Notes
----
1. Statistics for the original plan were averaged over 4 executions.
2. Statistics for the SQL profile plan were averaged over 10 executions.
------------------------------------------------------------------------------
SELECT DBMS_SQLTUNE.SCRIPT_TUNING_TASK(task_name=>'sql_t_byvg6t5kz8xk0', rec_type=>'ALL') FROM DUAL;
SQL> SELECT DBMS_SQLTUNE.SCRIPT_TUNING_TASK(task_name=>'sql_t', rec_type=>'ALL') FROM DUAL;
----------------------------------------------------------------
        - Script generated by DBMS_SQLTUNE package, advisor framework --
        - Use this script to implement some of the recommendations --
        - made by the SQL tuning advisor. --
        - --        - NOTE: this script may need to be edited for your system --
        - (index names, privileges, etc) before it is executed. --
----------------------------------------------------------------
接受性能较好的sqlprofile:
execute dbms_sqltune.accept_sql_profile(task_name => 'sql_t', replace => TRUE);
故障总结
综合上述分析判断:
1、insert SQL语句在数据库内部执行并不慢,在12毫秒左右,与其他程序的区别在于.NET自行发起的内部对象查询非实际应用发起,由于此现象为.NET特性无法改变,官方建议调大.NET端语句缓存,减少对数据库内部对象的查询,提高效率。
2、在数据库层面,对sql查询语句进行优化和对统计信息进行重新收集。
编辑推荐:
- 应用.net访问oracle数据库性能问题03-03
- oracle Snapshot standby database(snapshot打开备库)03-03
- exp导出报错EXP-00106问题处理03-03
- 数据库管理-第145期 最强Oracle监控EMCC深入使用-02(20240205)03-03
- oracle数仓rac两个节点查询耗时不一致问题处理03-03
- “火拼”年货节,拼多多、淘宝、京东“交锋”03-03
- ORA-00600: internal error code, arguments: [kzsrsea] DataGuard环境的异常03-03
- 第141期 DG PDB - Oracle DB 23c(20240129)03-03
相关推荐
-

-
-
-
-
-
-
-
-
-
-
-
-
-
-

雷神推出 MIX PRO II 迷你主机:基于 Ultra 200H,玻璃上盖 + ARGB 灯效
2 月 9 日消息,雷神 (THUNDEROBOT) 现已宣布推出基于英
-

制造商 Musnap 推出彩色墨水屏电纸书 Ocean C:支持手写笔、第三方安卓应用
2 月 10 日消息,制造商 Musnap 现已在海外推出一款 Oce

")

")

")

