事务提交的过程大致为:
1.用户进程发出commit命令 2.用户进程通知LGWR写Redo buffer数据到Redo文件 3.LGWR写Redo到文件 4.LGWR写完通知用户进程 5.用户进程收到写完成通知,提交完成。 6.CPU唤醒用户进程 从步骤1开始,用户进程开始等待log file sync,到步骤6结束。步骤3与步骤4中,LGWR等待log file parallel write。
一般来说,造成log file sync的原因有如下几点:
1.频繁commit或者rollback 2.IO缓慢 ,判断是否由于缓慢的日志I/O造成的,可以查看log file sync与log file parallel write两个等待事件的等待时间,如果比较接近,说明可能是日志I/O比较缓慢或重做日志过多 3.过大的日志缓冲区(Log Buffer) 过大的log_buffer,允许LGWR变得懒惰,因为log buffer中的数据量无法达不到_LOG_IO_SIZE,导致更多的重做条目堆积在日志缓冲区中。当事务提交或者3s时,LGWR才会把所有数据都写入到redo log file中。由于数据很多,LGWR要用更多时间等待redo写完毕。这种情况,可以调小参数_LOG_IO_SIZE参数,其默认值是LOG_BUFFER的1/3或1MB,取两者之中较小的值。 4.CPU负载高。 在系统负载高时(尤其是CPU高的情况,看vmstat r值),步骤5和6会变得非常明显。因为前台收到LGWR写入完成的通知后,操作系统需要消耗一些时间调度Foreground/user session进程唤醒(也就是CPU调度) 5.RAC私有网络性能差,导致LMS同步commit SCN慢
模拟循环提交的情景:
--创建测试表
SQL> create table scott.tb_test (id int,age int,name varchar2(20));
--手动采集报告
exec dbms_workload_repository.create_snapshot();
--模拟多次提交
SQL> begin
for i in 1..5000000 loop
insert into scott.tb_test values(1,10,'test');
commit work write wait immediate; --pl/sql中如果只写commit默认是批量提交,并不会模拟出log file sync
end loop;
end;
/
--执行完后再次采集报告
SQL> exec dbms_workload_repository.create_snapshot();
在插入的过程中查看等待事件:
SQL> select inst_id
2 ,event
3 ,count(0)
4 from gv$session where wait_class != 'Idle' group by inst_id,event order by inst_id,count(0) desc;
INST_ID EVENT COUNT(0)
---------- ------------------------------------------------------------ ----------
1 log file parallel write 1
1 log file sync 1
1 SQL*Net message to client 1
可看到
log file sync
与log file parallel write等待事件都出现了
查看log file sync总等待次数与总等待时间:
SQL> SET LINES 200 PAGES 100
SQL> SELECT INST_ID
2 ,SID
3 ,EVENT
4 ,TOTAL_WAITS WAITS_CNT
5 ,TIME_WAITED
6 ,AVERAGE_WAIT/100 "AVERAGE_WAIT(S)"
7 ,MAX_WAIT/100 "MAX_WAIT(S)"
8 FROM GV$SESSION_EVENT
9 WHERE SID=&INPUT_SID
10 ORDER BY TOTAL_WAITS DESC;
Enter value for input_sid: 812
old 9: WHERE SID=&INPUT_SID
new 9: WHERE SID=812
INST_ID SID EVENT WAITS_CNT TIME_WAITED AVERAGE_WAIT(S) MAX_WAIT(S)
---------- ---------- ------------------------------------------------------------ ---------- ----------- --------------- -----------
1 812
log file sync
1812509 54140 .0003 .5
1 812 db file sequential read 2183 289 .0013 .13
1 812 db file scattered read 1285 65 .0005 .03
1 812 control file sequential read 1266 1 0 0
1 812 SQL*Net message from client 918 581782 6.3375 1866.37
1 812 SQL*Net message to client 918 0 0 0
1 812 events in waitclass Other 179 2 .0001 0
1 812 direct path read 152 1 .0001 .01
1 812 latch: shared pool 27 0 .0001 0
1 812 SQL*Net more data to client 25 0 0 0
1 812 direct path write 25 0 0 0
1 812 Disk file operations I/O 16 0 .0001 0
1 812 log file switch completion 16 8 .0048 .01
1 812 Data file init write 13 1 .0005 0
1 812 local write wait 13 1 .0007 0
1 812 enq: RO - fast object reuse 9 2 .002 .01
1 812 SQL*Net break/reset to client 9 0 0 0
1 812 control file parallel write 6 0 .0004 0
1 812 buffer busy waits 4 0 .0001 0
1 812 undo segment extension 3 2 .0065 .02
1 812 db file parallel read 3 1 .0027 .01
1 812 db file single write 2 0 .0004 0
1 812 latch: cache buffers chains 1 0 0 0
1 812 direct path sync 1 0 .0016 0
24 rows selected.
SQL> /
Enter value for input_sid: 812
old 9: WHERE SID=&INPUT_SID
new 9: WHERE SID=812
INST_ID SID EVENT WAITS_CNT TIME_WAITED AVERAGE_WAIT(S) MAX_WAIT(S)
---------- ---------- ------------------------------------------------------------ ---------- ----------- --------------- -----------
1 812
log file sync
1825671 54541 .0003 .5
1 812 db file sequential read 2183 289 .0013 .13
1 812 db file scattered read 1285 65 .0005 .03
1 812 control file sequential read 1266 1 0 0
1 812 SQL*Net message from client 918 581782 6.3375 1866.37
1 812 SQL*Net message to client 918 0 0 0
1 812 events in waitclass Other 179 2 .0001 0
1 812 direct path read 152 1 .0001 .01
1 812 latch: shared pool 27 0 .0001 0
1 812 SQL*Net more data to client 25 0 0 0
1 812 direct path write 25 0 0 0
1 812 Disk file operations I/O 16 0 .0001 0
1 812 log file switch completion 16 8 .0048 .01
1 812 Data file init write 13 1 .0005 0
1 812 local write wait 13 1 .0007 0
1 812 enq: RO - fast object reuse 9 2 .002 .01
1 812 SQL*Net break/reset to client 9 0 0 0
1 812 control file parallel write 6 0 .0004 0
1 812 buffer busy waits 4 0 .0001 0
1 812 undo segment extension 3 2 .0065 .02
1 812 db file parallel read 3 1 .0027 .01
1 812 db file single write 2 0 .0004 0
1 812 latch: cache buffers chains 1 0 0 0
1 812 direct path sync 1 0 .0016 0
24 rows selected.
可看到等待次数与等待时间
一直在增长
。
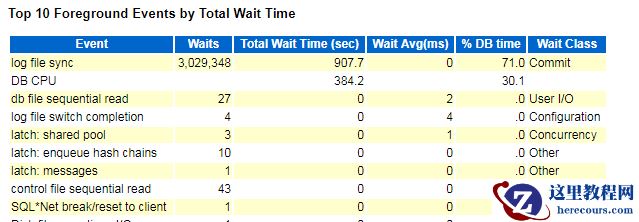
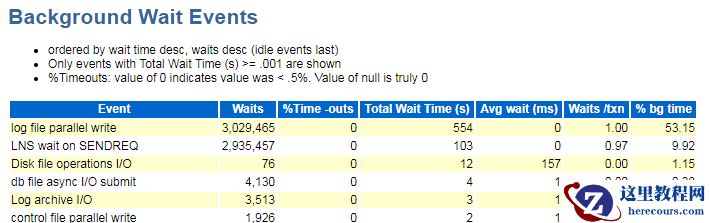
待插入完成后,拉取awr报告与ash报告,可看到在Top 10 Foreground Events by Total Wait Time中,log file sync等待时间为908s,占了总DB Time的71%;在Background Wait Events中,log file parallel write等待时间为554s,占整个Background Time的53%。
 查看ash报告,再Top SQL with Top Events中可看到引起log file sync的SQL语句,查看完整脚本,正好是我们发出的语句

 将循环提交改为批量提交后,重新实验
SQL> create table scott.tb_test (id int,age int,name varchar2(20));
Table created
exec dbms_workload_repository.create_snapshot();
begin
for i in 1..5000000 loop
insert into scott.tb_test values(1,10,'test');
end loop;
commit work write wait immediate;
end;
/
exec dbms_workload_repository.create_snapshot();
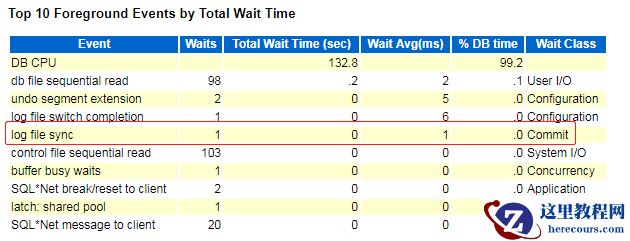
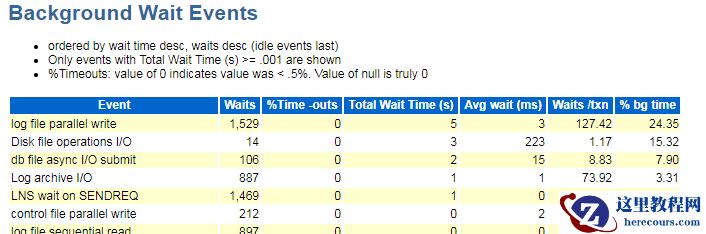
拉取awr报告后,可看到log file sync只等待了一次,占比已经降下来了。log file parallel write占比仍比较高,这是因为我们的事务太大造成的。
将循环提交改为批量提交后,重新实验
SQL> create table scott.tb_test (id int,age int,name varchar2(20));
Table created
exec dbms_workload_repository.create_snapshot();
begin
for i in 1..5000000 loop
insert into scott.tb_test values(1,10,'test');
end loop;
commit work write wait immediate;
end;
/
exec dbms_workload_repository.create_snapshot();
拉取awr报告后,可看到log file sync只等待了一次,占比已经降下来了。log file parallel write占比仍比较高,这是因为我们的事务太大造成的。
注意:
1.log file sync等待次数基本和数据库事务数持平。log file sync等待是无法避免,但高事务量的系统容易引起大量的log file sync的等待事件。 2.平均等待时间不应高于7ms, 如果平均等待时间比较高,则说明IO有问题。 3.如果log file sync等待时间如果明显大于log file parallel write,则可能有几方面原因: 1)CPU资源紧张 2)同时提交的进程比较多 3)遭遇Bug. 4.如果log file sync等待时间小于log file parallel write,则应该是事务比较大,在用户commit之前LGWR已经多次写Log Buffer到log文件了。


")


