[20221023]v$session_longops.txt --//重复测试,链接:https://jonathanlewis.wordpress.com/2022/10/13/vsession_longops-2/ --//To demonstrate the principle that the "working time" for an operation and the elapsed time to completion can be --//dramatically different I'll set up a two-table join and show that a "small tablescan" can (apparently) take a long time --//and get into v$session_longops because of "the other" table. As a quick and dirty trick I'll create a function that --//calls dbms_session.sleep() – the function that should be used to replace calls to dbms_lock.sleep()– to sleep for --//1/100 second. --//为了证明操作的工作时间和完成时间可能有显著不同的原理,我将设置一个双表连接,并显示一个小表可以(显然)需要很长时间并进 --//入v$session_longops,因为另一个表。作为一个快速而糟糕的技巧,我将创建一个调用dbms_session.sleep()的函数——这个应该 --//用于替换调用dbms_lock.sleep()的函数——以睡眠1/100秒。 1.环境: SCOTT@book> @ver1 PORT_STRING VERSION BANNER ------------------------------ -------------- -------------------------------------------------------------------------------- x86_64/Linux 2.4.xx 11.2.0.4.0 Oracle Database 11g Enterprise Edition Release 11.2.0.4.0 - 64bit Production 2.脚本建立: create table t1 as with generator as ( select rownum id from dual connect by level <= 1e4 -- > comment to avoid WordPress format issue ) select rownum id, rownum n1, lpad(rownum,10,'0') v1, lpad('x',100,'x') padding from generator v1, generator v2 where rownum <= 1e6 -- > comment to avoid WordPress format issue ; create table t2 as select * from t1; alter table t2 add constraint t2_pk primary key(id); create or replace function waste_time(i_in number) return number as begin --dbms_session.sleep(0.01); dbms_lock.sleep(0.01); return i_in; end; / --//注我分析了表T1,T2. --//With the data and function in place I'll code (and hint) a nested loop join that starts with a full tablescan of t1 --//and probes t2 by primary key 1,000 times. --//有了数据和函数,我将编码(并提示)一个嵌套的循环连接,它从t1的完整表扫描开始,并通过主键探测t2 1000次。 3.执行: SCOTT@book> @ sl all alter session set statistics_level = all; Session altered. set timing on select /*+ leading(t1 t2) full(t1) use_nl_with_index(t2) */ sum(t1.id) from t1, t2 where mod(t1.id,1000) = 0 and t2.id = t1.id and t2.n1 != 0 / SUM(T1.ID) ---------- 500500000 Elapsed: 00:00:00.41 select /*+ leading(t1 t2) full(t1) use_nl_with_index(t2) */ sum(t1.id) from t1, t2 where mod(t1.id,1000) = 0 and t2.id = t1.id and waste_time(t2.n1) != 0 / SUM(T1.ID) ---------- 500500000 Elapsed: 00:00:11.06 set timing off --//Of course, thanks to the call to waste_time() passing in t2.n1 I expect the second version of the query to take at least --//10 seconds longer than the first (given 1,000 waits of 0.01 seconds spent in the call). --//当然,由于调用t2中的wase_time()。我预计第二个版本的查询比第一个版本至少长10秒(给定在调用中花费1000次等待0.01秒)。 --//以下是作者的测试结果. SUM(T1.ID) ---------- 500500000 1 row selected. Elapsed: 00:00:00.26 SUM(T1.ID) ---------- 500500000 1 row selected. Elapsed: 00:00:14.39 --//我的测试11秒.与他的测试结果不同, 但是不影响问题说明. --//So the question is – what does v$session_longops say about any "long operations" for my session? Query and result: --//所以问题是,v$session_longops对我的长期操作有何看法?查询及结果: select sql_id, sql_plan_line_id, to_char(vsl.start_time,'dd hh24:mi:ss') start_time, to_char(vsl.last_update_time,'dd hh24:mi:ss') last_time, vsl.elapsed_seconds, vsl.message from V$session_Longops vsl where vsl.sid = (select ms.sid from v$mystat ms where rownum = 1) / SQL_ID SQL_PLAN_LINE_ID START_TIME LAST_TIME ELAPSED_SECONDS MESSAGE ------------- ---------------- ----------- ----------- --------------- ----------------------------------------------------- 4sjt90h0tsr3q 4 23 08:54:16 23 08:54:27 11 Table Scan: SCOTT.T1: 18028 out of 18028 Blocks done --//So that looks like 14 seconds to do a tablescan of just 18,020 blocks. The number is very similar to the elapsed time --//reported for the second of my two queries – but just to make sure let's use the reported SQL ID to pull the query and --//plan from memory and check operation 4 for a tablescan of t1. --//做一个只有18020个块的表扫描看起来需要14秒。这个数字与我的两个查询中第二个报告的时间非常相似——但只是为了确保我们使用报 --//告的SQL ID从内存中提取查询和计划,并检查t1的表扫描操作4。 SCOTT@book> @ dpc 4sjt90h0tsr3q '' '' PLAN_TABLE_OUTPUT ------------------------------------- SQL_ID 4sjt90h0tsr3q, child number 0 ------------------------------------- select /*+ leading(t1 t2) full(t1) use_nl_with_index(t2) */ sum(t1.id) from t1, t2 where mod(t1.id,1000) = 0 and t2.id = t1.id and waste_time(t2.n1) != 0 Plan hash value: 1846150233 ------------------------------------------------------------------------------------------------------------------------------------------ | Id | Operation | Name | Starts | E-Rows |E-Bytes| Cost (%CPU)| E-Time | A-Rows | A-Time | Buffers | Reads | ------------------------------------------------------------------------------------------------------------------------------------------ | 0 | SELECT STATEMENT | | 1 | | | 24904 (100)| | 1 |00:00:11.01 | 20941 | 17853 | | 1 | SORT AGGREGATE | | 1 | 1 | 15 | | | 1 |00:00:11.01 | 20941 | 17853 | | 2 | NESTED LOOPS | | 1 | 10000 | 146K| 24904 (1)| 00:04:59 | 1000 |00:00:11.01 | 20941 | 17853 | | 3 | NESTED LOOPS | | 1 | 10000 | 146K| 24904 (1)| 00:04:59 | 1000 |00:00:00.56 | 19858 | 17853 | |* 4 | TABLE ACCESS FULL | T1 | 1 | 10000 | 50000 | 4898 (1)| 00:00:59 | 1000 |00:00:00.54 | 17856 | 17853 | |* 5 | INDEX UNIQUE SCAN | T2_PK | 1000 | 1 | | 1 (0)| 00:00:01 | 1000 |00:00:00.02 | 2002 | 0 | |* 6 | TABLE ACCESS BY INDEX ROWID| T2 | 1000 | 1 | 10 | 2 (0)| 00:00:01 | 1000 |00:00:10.44 | 1083 | 0 | ------------------------------------------------------------------------------------------------------------------------------------------ Query Block Name / Object Alias (identified by operation id): ------------------------------------------------------------- 1 - SEL$1 4 - SEL$1 / T1@SEL$1 5 - SEL$1 / T2@SEL$1 6 - SEL$1 / T2@SEL$1 Predicate Information (identified by operation id): --------------------------------------------------- 4 - filter(MOD("T1"."ID",1000)=0) 5 - access("T2"."ID"="T1"."ID") 6 - filter("WASTE_TIME"("T2"."N1")<>0) 35 rows selected. --//结合上面看,实际上消耗最大的还是在id=6上而不是id=4.也就是不是V$session_Longops上显示的Table Scan: SCOTT.T1: 18028 --//out of 18028 Blocks done.很容易出现歧义. --//作者在注解处加入注解: --//v$session_longops (Oct 2022): how to interpret the information. It's not the answer, it's a clue. […] --//如果修改建立函数索引如下: SCOTT@book> create index if_t1_id on t1(mod(id,1000)) ; Index created. select /*+ leading(t1 t2) index(t1) use_nl_with_index(t2) */ sum(t1.id) from t1, t2 where mod(t1.id,1000) = 0 and t2.id = t1.id and waste_time(t2.n1) != 0 / SUM(T1.ID) ---------- 500500000 Elapsed: 00:00:11.03 SCOTT@book> @ dpc '' '' '' PLAN_TABLE_OUTPUT ------------------------------------- SQL_ID bquvd2kv3ugkd, child number 0 ------------------------------------- select /*+ leading(t1 t2) index(t1) use_nl_with_index(t2) */ sum(t1.id) from t1, t2 where mod(t1.id,1000) = 0 and t2.id = t1.id and waste_time(t2.n1) != 0 Plan hash value: 1272872847 ---------------------------------------------------------------------------------------------------------------------------------------------- | Id | Operation | Name | Starts | E-Rows |E-Bytes| Cost (%CPU)| E-Time | A-Rows | A-Time | Buffers | Reads | ---------------------------------------------------------------------------------------------------------------------------------------------- | 0 | SELECT STATEMENT | | 1 | | | 24010 (100)| | 1 |00:00:11.00 | 4006 | 991 | | 1 | SORT AGGREGATE | | 1 | 1 | 28 | | | 1 |00:00:11.00 | 4006 | 991 | | 2 | NESTED LOOPS | | 1 | 10000 | 273K| 24010 (1)| 00:04:49 | 1000 |00:00:11.00 | 4006 | 991 | | 3 | NESTED LOOPS | | 1 | 10000 | 273K| 24010 (1)| 00:04:49 | 1000 |00:00:00.08 | 3006 | 991 | | 4 | TABLE ACCESS BY INDEX ROWID| T1 | 1 | 10000 | 175K| 4005 (1)| 00:00:49 | 1000 |00:00:00.06 | 1004 | 991 | |* 5 | INDEX RANGE SCAN | IF_T1_ID | 1 | 4000 | | 4 (0)| 00:00:01 | 1000 |00:00:00.01 | 4 | 3 | |* 6 | INDEX UNIQUE SCAN | T2_PK | 1000 | 1 | | 1 (0)| 00:00:01 | 1000 |00:00:00.02 | 2002 | 0 | |* 7 | TABLE ACCESS BY INDEX ROWID | T2 | 1000 | 1 | 10 | 2 (0)| 00:00:01 | 1000 |00:00:10.91 | 1000 | 0 | ---------------------------------------------------------------------------------------------------------------------------------------------- Query Block Name / Object Alias (identified by operation id): ------------------------------------------------------------- 1 - SEL$1 4 - SEL$1 / T1@SEL$1 5 - SEL$1 / T1@SEL$1 6 - SEL$1 / T2@SEL$1 7 - SEL$1 / T2@SEL$1 Predicate Information (identified by operation id): --------------------------------------------------- 5 - access("T1"."SYS_NC00005$"=0) 6 - access("T2"."ID"="T1"."ID") 7 - filter("WASTE_TIME"("T2"."N1")<>0) 37 rows selected. select sql_id, sql_plan_line_id, to_char(vsl.start_time,'dd hh24:mi:ss') start_time, to_char(vsl.last_update_time,'dd hh24:mi:ss') last_time, vsl.elapsed_seconds, vsl.message from V$session_Longops vsl where vsl.sid = (select ms.sid from v$mystat ms where rownum = 1) / SQL_ID SQL_PLAN_LINE_ID START_TIME LAST_TIME ELAPSED_SECONDS MESSAGE ------------- ---------------- ----------- ----------- --------------- ----------------------------------------------------- 4sjt90h0tsr3q 4 23 08:58:12 23 08:58:23 11 Table Scan: SCOTT.T1: 18028 out of 18028 Blocks done bquvd2kv3ugkd 4 23 09:04:26 23 09:04:37 11 Table Scan: SCOTT.T1: 18028 out of 18028 Blocks done --//还是提示Table Scan: SCOTT.T1: 18028 out of 18028 Blocks done. SCOTT@book> @ sosiz scott t1 ********************************** Table Level 参数 schema tablename ********************************** Table Number Empty Average Chain Average Global User Sample Name of Rows Blocks Blocks Space Count Row Len Stats Stats Size LAST_ANALYZED --------------- -------------- ------------ ------------ -------- -------- -------- ------ ------ -------------- ------------------- T1 1,000,000 18,028 0 0 0 122 YES NO 1,000,000 2022-11-23 08:57:35 Column Column Distinct Number Number Global User Sample Name Details Values Density Buckets Nulls Stats Stats Size LAST_ANALYZED HISTOGRAM ------------------------- ------------------------ ------------ ----------- ------- ---------- ------ ------ -------------- ------------------- --------------- ID NUMBER(22) 1,000,000 0.00000100 1 0 YES NO 1,000,000 2022-11-23 08:57:35 NONE N1 NUMBER(22) 1,000,000 0.00000100 1 0 YES NO 1,000,000 2022-11-23 08:57:35 NONE V1 VARCHAR2(20) 1,000,000 0.00000100 1 0 YES NO 1,000,000 2022-11-23 08:57:35 NONE PADDING VARCHAR2(100) 1 1.00000000 1 0 YES NO 1,000,000 2022-11-23 08:57:35 NONE B Average Average Index Tree Leaf Distinct Number Leaf Blocks Data Blocks Cluster Global User Sample Name Unique Level Blks Keys of Rows Per Key Per Key Factor Stats Stats Size LAST_ANALYZED ------------------------- --------- ----- ------ -------------- -------------- ----------- ----------- ------------ ------ ------ -------------- ------------------- IF_T1_ID NONUNIQUE 2 2077 1,000 1,000,000 2 1,000 1,000,000 YES NO 1,000,000 2022-11-23 09:07:34 --//这个更加容易理解错误,我不扫描表T1,T1表的Blocks=18028,走的是索引IF_T1_ID.而执行计划sql_id=bquvd2kv3ugkd,提示还是 --//Table Scan: SCOTT.T1: 18028 out of 18028 Blocks done. Summary When you see an entry in v$session_longops it is an indicator to an operation that took a "long" time to complete; but "completion" of the operation and "work done" by the operation are not the same thing. The operation may be the victim of a problem, not the cause. If the problem query is still in memory then v$session_long_ops gives you enough information to find the query (and check you're looking at the right plan) so that you have a better chance of identifying the real offender. 当您在v$session_longops中看到一个条目时,它是一个操作的指示器,需要长时间来完成操作和已完成的工作通过操作不是一回事。这 次手术可能是问题的受害者,而不是原因。如果问题查询仍然在内存中,那么v$session_long_ops将给您足够的信息来找到查询(并检查 您是否查看正确的计划),这样您就有更好的机会识别真正的违规者。 --//也就是 v$session_longops提示有一条语句执行很慢,不能依靠MESSAGE提示信息解决定位问题.
[20221023]v$session_longops.txt
来源:这里教程网
时间:2026-03-03 18:10:06
作者:
编辑推荐:
- [20221023]v$session_longops.txt03-03
- 一个惊出一身冷汗的报错03-03
- [20221121]rman删除归档日志问题.txt03-03
- [20221123]19cDBA_EXPRESSION_STATISTICS查询expression_text中字符串带双引号的问题03-03
- Oracle 11.2.0.4 通过透明网关访问mysql 8.0.1603-03
- 华为云数据库GaussDB持续技术创新,助推企业释放数字生产力03-03
- 【BUILD_ORACLE】在Oracle cloud数据库“插拔”PDB的方法03-03
- SQL语言基础(SELECT语句)03-03
下一篇:
相关推荐
-

-
-
-
-
-
-
-
-
-
-
-
-
-
-

雷神推出 MIX PRO II 迷你主机:基于 Ultra 200H,玻璃上盖 + ARGB 灯效
2 月 9 日消息,雷神 (THUNDEROBOT) 现已宣布推出基于英
-

制造商 Musnap 推出彩色墨水屏电纸书 Ocean C:支持手写笔、第三方安卓应用
2 月 10 日消息,制造商 Musnap 现已在海外推出一款 Oce
热文推荐
- 一个惊出一身冷汗的报错
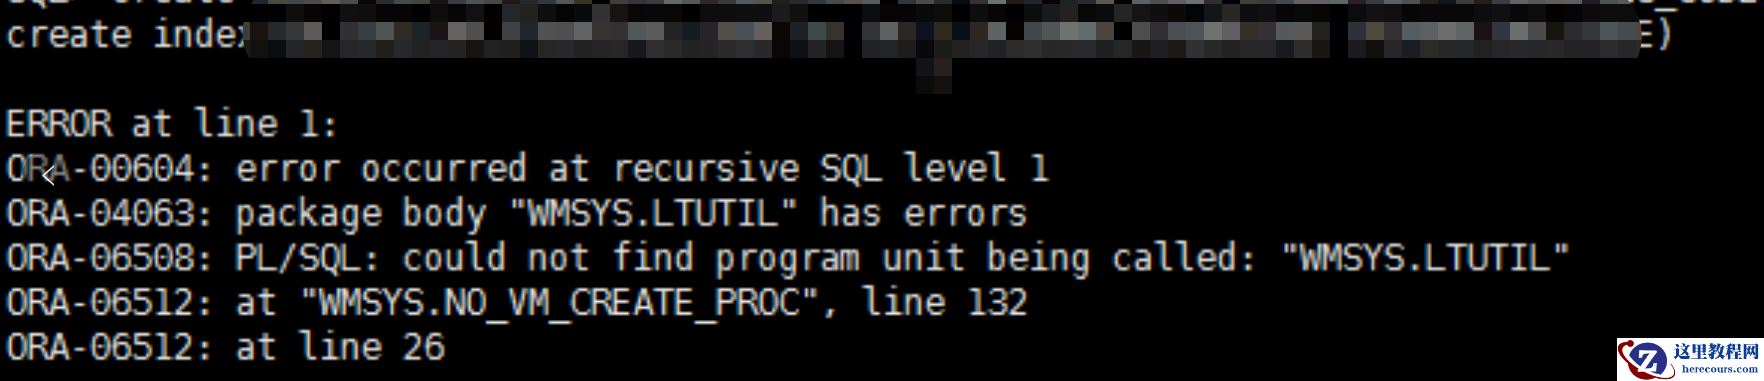
一个惊出一身冷汗的报错
26-03-03 - 华为云数据库GaussDB持续技术创新,助推企业释放数字生产力

华为云数据库GaussDB持续技术创新,助推企业释放数字生产力
26-03-03 - SQL语言基础(SELECT语句)
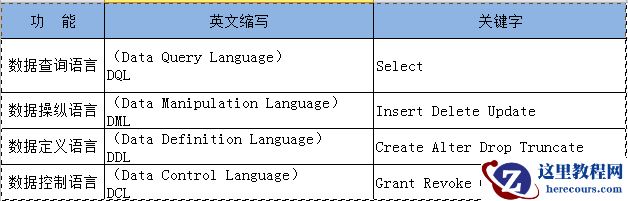
SQL语言基础(SELECT语句)
26-03-03 - 抖音、快手、视频号排兵布阵VR直播
抖音、快手、视频号排兵布阵VR直播
26-03-03 - 美团Q3财报解读:即时零售订单量50亿笔,变身本地超市?
美团Q3财报解读:即时零售订单量50亿笔,变身本地超市?
26-03-03 - 华为云会议,云上办公更轻松高效

华为云会议,云上办公更轻松高效
26-03-03 - 华为云会议录制能力再升级,会议成果全收录!

华为云会议录制能力再升级,会议成果全收录!
26-03-03 - 分布式光伏运维平台AcrelCloud-1200可用于农村屋顶的户用光伏和工商业企业屋顶光伏
- 华为云桌面Workspace云上办公,方便得很!

华为云桌面Workspace云上办公,方便得很!
26-03-03 - Oracle 12c RAC CSSD进程无法启动real time模式
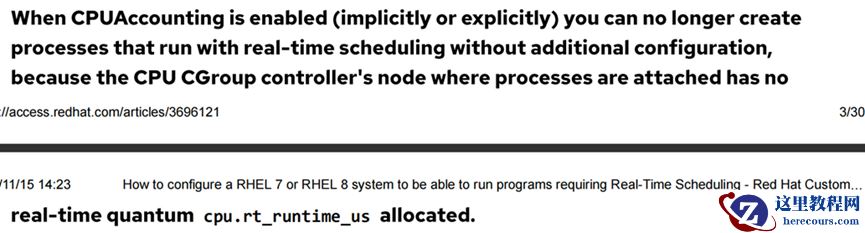
Oracle 12c RAC CSSD进程无法启动real time模式
26-03-03